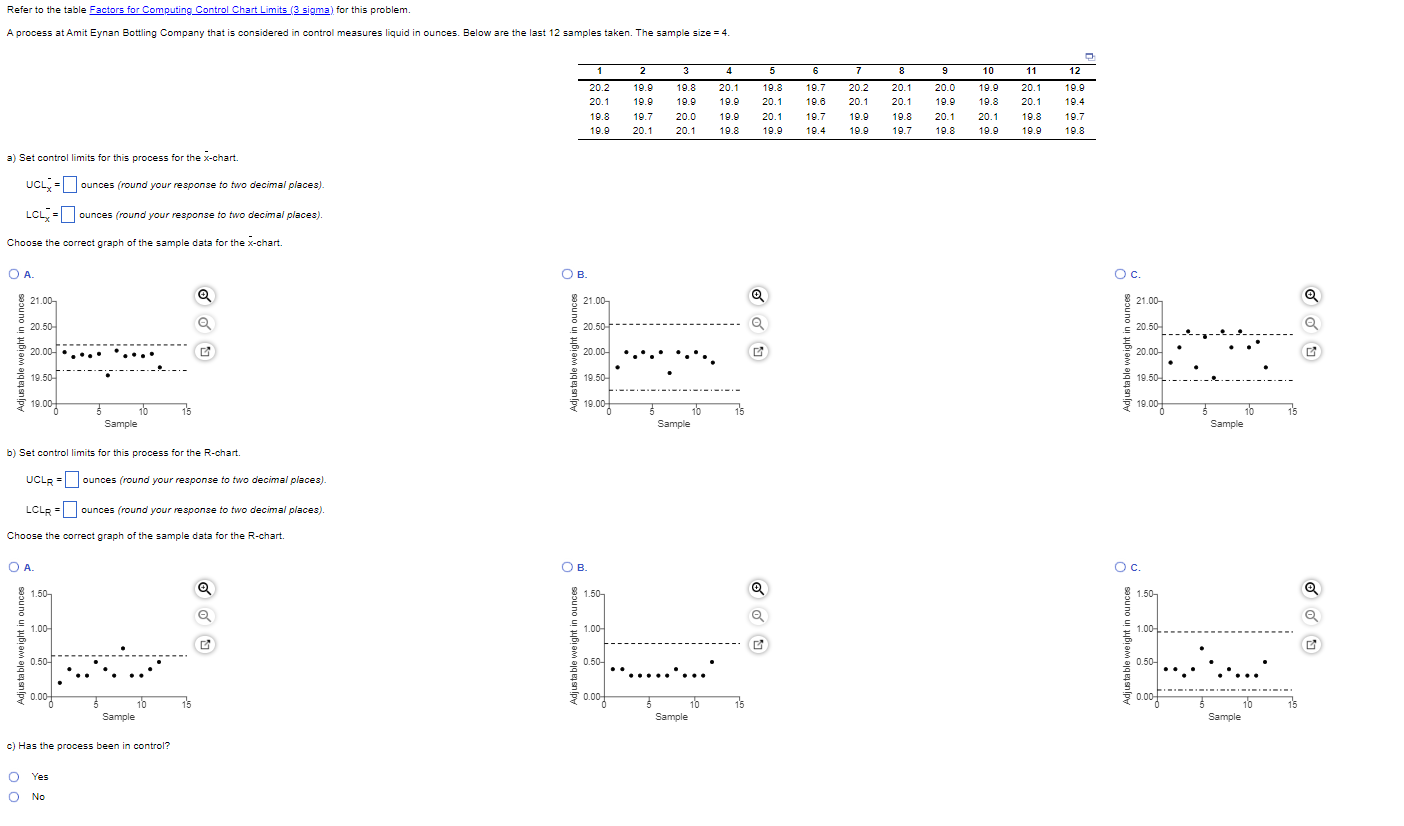
Question: a) Set control limits for this process for the x-chart. UCLx=ounces (round your response to two decimal places). LCLX=ounces (round your response to two decimal

a) Set control limits for this process for the

a) Set control limits for this process for the x-chart. UCLx=ounces (round your response to two decimal places). LCLX=ounces (round your response to two decimal places). Choose the correct graph of the sample data for the x-chart. b) Set control limits for this process for the R-chart. UCLRR ounces (round your response to two decimal places). LCLR : ounces (round your response to two decimal places). Choose the correct graph of the sample data for the R-chart. c) Has the process been in control? Yes No

Step by Step Solution

There are 3 Steps involved in it

1 Expert Approved Answer
Step: 1 Unlock blur-text-image
Question Has Been Solved by an Expert!

Get step-by-step solutions from verified subject matter experts

Step: 2 Unlock
Step: 3 Unlock

Students Have Also Explored These Related General Management Questions!