

Question: a. set up 2 by 2 table for data b. calculate odds ratio c. state interpretation of ratio d. (in pic) 1. Suppose that a
a. set up 2 by 2 table for data 
1. Suppose that a case-control study was conducted in the United States to find out whether a Black woman's exposure to racism during pregnancy influenced her risk of giving birth prematurely. Investigators selected 500 cases who were hospitalized for premature delivery and 1,000 controls. The study found that 90 case mothers and 50 control mothers reported overt incidents of racism during their pregnancy. Answer the following questions based on the information in the paragraph above: a. Set up the two-by-two table for these data. Mother exposed to overt incidents Preterm delivery of racism during pregnancy Yes (Cases) No (Controls) Yes (Exposed) No (Not Exposed) Total b. Calculate the odds ratio (be sure to show your work). C. State in words your interpretation of this odds ratio. I d. Suppose that the investigators hire you as an epidemiological consultant to help them design this study. They ask you what type of control group is most appropriate for the study. Briefly describe the control group that you would advise them to select, and justify your choice b. calculate odds ratio
c. state interpretation of ratio
d. (in pic) 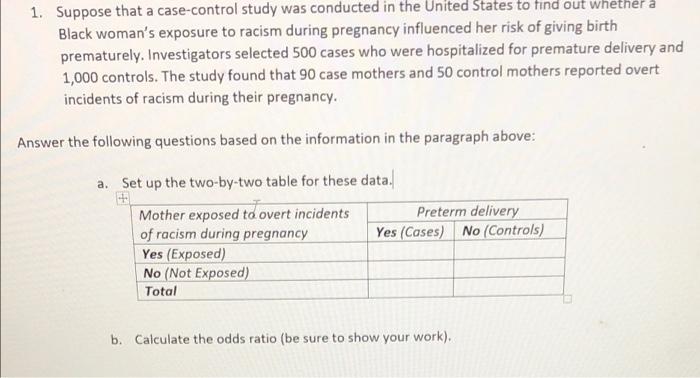
Step by Step Solution
There are 3 Steps involved in it
1 Expert Approved Answer
Step: 1 Unlock

Question Has Been Solved by an Expert!
Get step-by-step solutions from verified subject matter experts
Step: 2 Unlock
Step: 3 Unlock