

Question: (a) Setup the simulation environment as shown in Fig. 3. Explain the direction of the field on the surface of the sphere. (b) Calculate
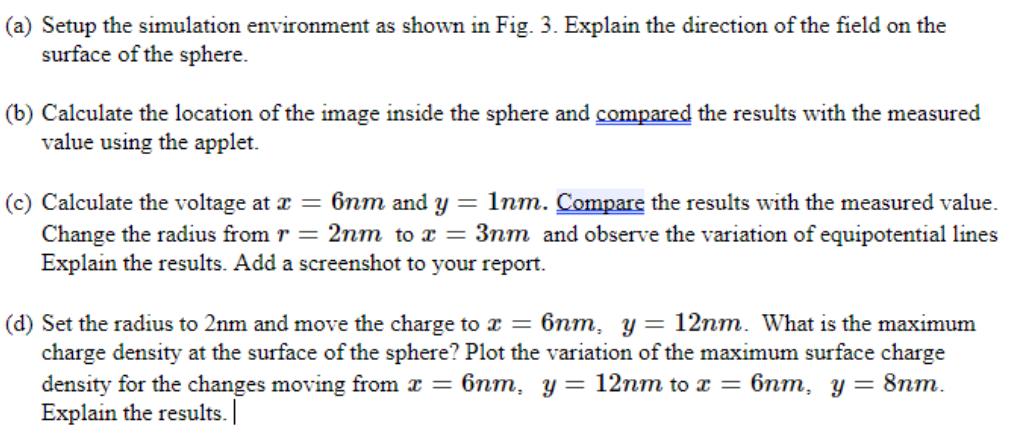
(a) Setup the simulation environment as shown in Fig. 3. Explain the direction of the field on the surface of the sphere. (b) Calculate the location of the image inside the sphere and compared the results with the measured value using the applet. (c) Calculate the voltage at x=6nm and y = 1nm. Compare the results with the measured value. Change the radius from r = 2nm to x = 3nm and observe the variation of equipotential lines Explain the results. Add a screenshot to your report. (d) Set the radius to 2nm and move the charge to x = 6nm, y 12nm. What is the maximum charge density at the surface of the sphere? Plot the variation of the maximum surface charge density for the changes moving from x = 6nm, y = 12nm to x = 6nm, y=8nm. Explain the results. | Vaw a Charges 11 10 5 5 D 1 1 EN m 17 1 t 810 11 12 130mm
Step by Step Solution
There are 3 Steps involved in it

Get step-by-step solutions from verified subject matter experts