

The experiments on reaction A B were carried out and the conversion-rate data is given in
Question:
The experiments on reaction A → B were carried out and the conversion-rate data is given in Table P2-11.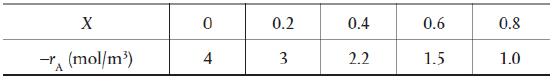
a. What are the batch reactor times to achieve 10%, 50%, and 80% for the reactor A → B when the initial concentration is 2 molar?
b. Plot the reaction rate, –rA, as a function of time up to a time necessary to achieve 80% conversion. Additional Homework Problems can be found on the CRE Web site under Chapter 2 A. EXERCISES hot button. Supplementary Reading Further discussion of the proper staging of reactors in series for various rate laws, in which a plot of (=1/rA) versus X is given, may or may not be presented in THORNTON W. BURGESS, The Adventures of Poor Mrs. Quack, New York: Dover Publications, Inc., 1917. CHESTER L. KARRASS, Effective Negotiating: Workbook and Discussion Guide, Beverly Hills, CA: Karrass Ltd., 2004. OCTAVE LEVENSPIEL, Chemical Reaction Engineering, 3rd ed. New York: Wiley, 1999.
Step by Step Answer:
a The time for 10 conversion can be found out by evaluating the in...View the full answer


