

Question: A shift in the process mean for a measured variable would be best detected by a s chart b. barchart OC. R chart c chart
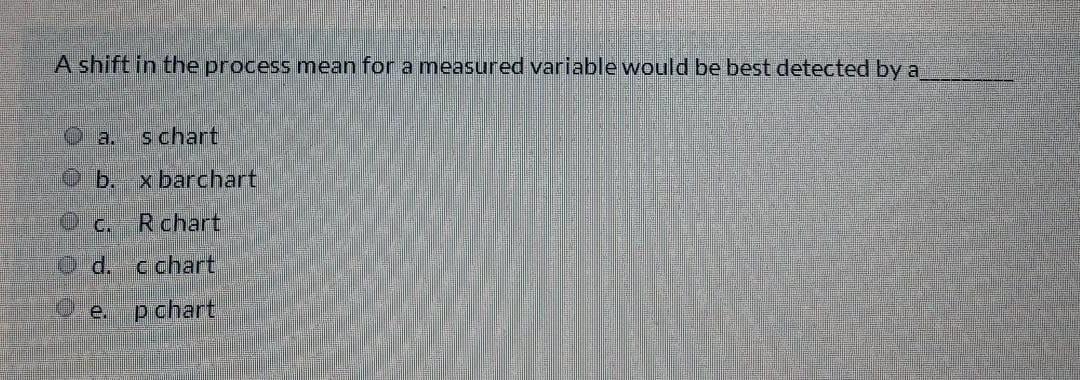
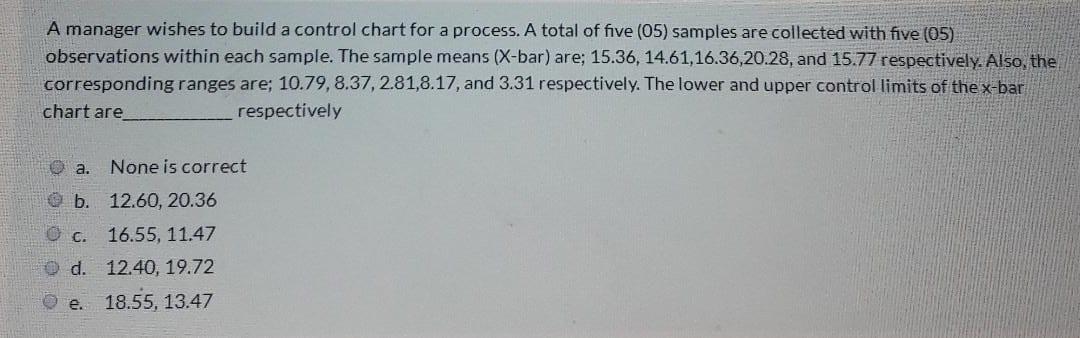
A shift in the process mean for a measured variable would be best detected by a s chart b. barchart OC. R chart c chart e. p chart A manager wishes to build a control chart for a process. A total of five (05) samples are collected with five (05) observations within each sample. The sample means (X-bar) are; 15.36, 14.61,16.36,20.28, and 15.77 respectively. Also, the corresponding ranges are; 10.79, 8.37, 2.81,8.17, and 3.31 respectively. The lower and upper control limits of the x-bar chart are respectively a. None is correct b. 12.60, 20.36 c. 16.55, 11.47 d. 12.40, 19.72 e. 18.55, 13.47
Step by Step Solution
There are 3 Steps involved in it
1 Expert Approved Answer
Step: 1 Unlock

Question Has Been Solved by an Expert!
Get step-by-step solutions from verified subject matter experts
Step: 2 Unlock
Step: 3 Unlock