

Question: a simple change in scale or using a y-axis that starts from an arbitrary selected point instead of starting at 0 may result in largely
a simple change in scale or using a y-axis that starts from an arbitrary selected point instead of starting at 0 may result in largely distorted data. will be doing a simple assignment that demonstrates how a choice of a length of time in a chart can completely change the picture and hide the full story from the observers. I would like you to have experience with real world data because this is what you are surrounded by every day, and one of the goals of this course is to help you become a better, more competent consumers of information.
So, this time I ask you to open Yahoo finance website to look at the stock reports. They are compiled continuously and are freely available for everyone to study. It can be accessed at the following link:https://finance.yahoo.com/
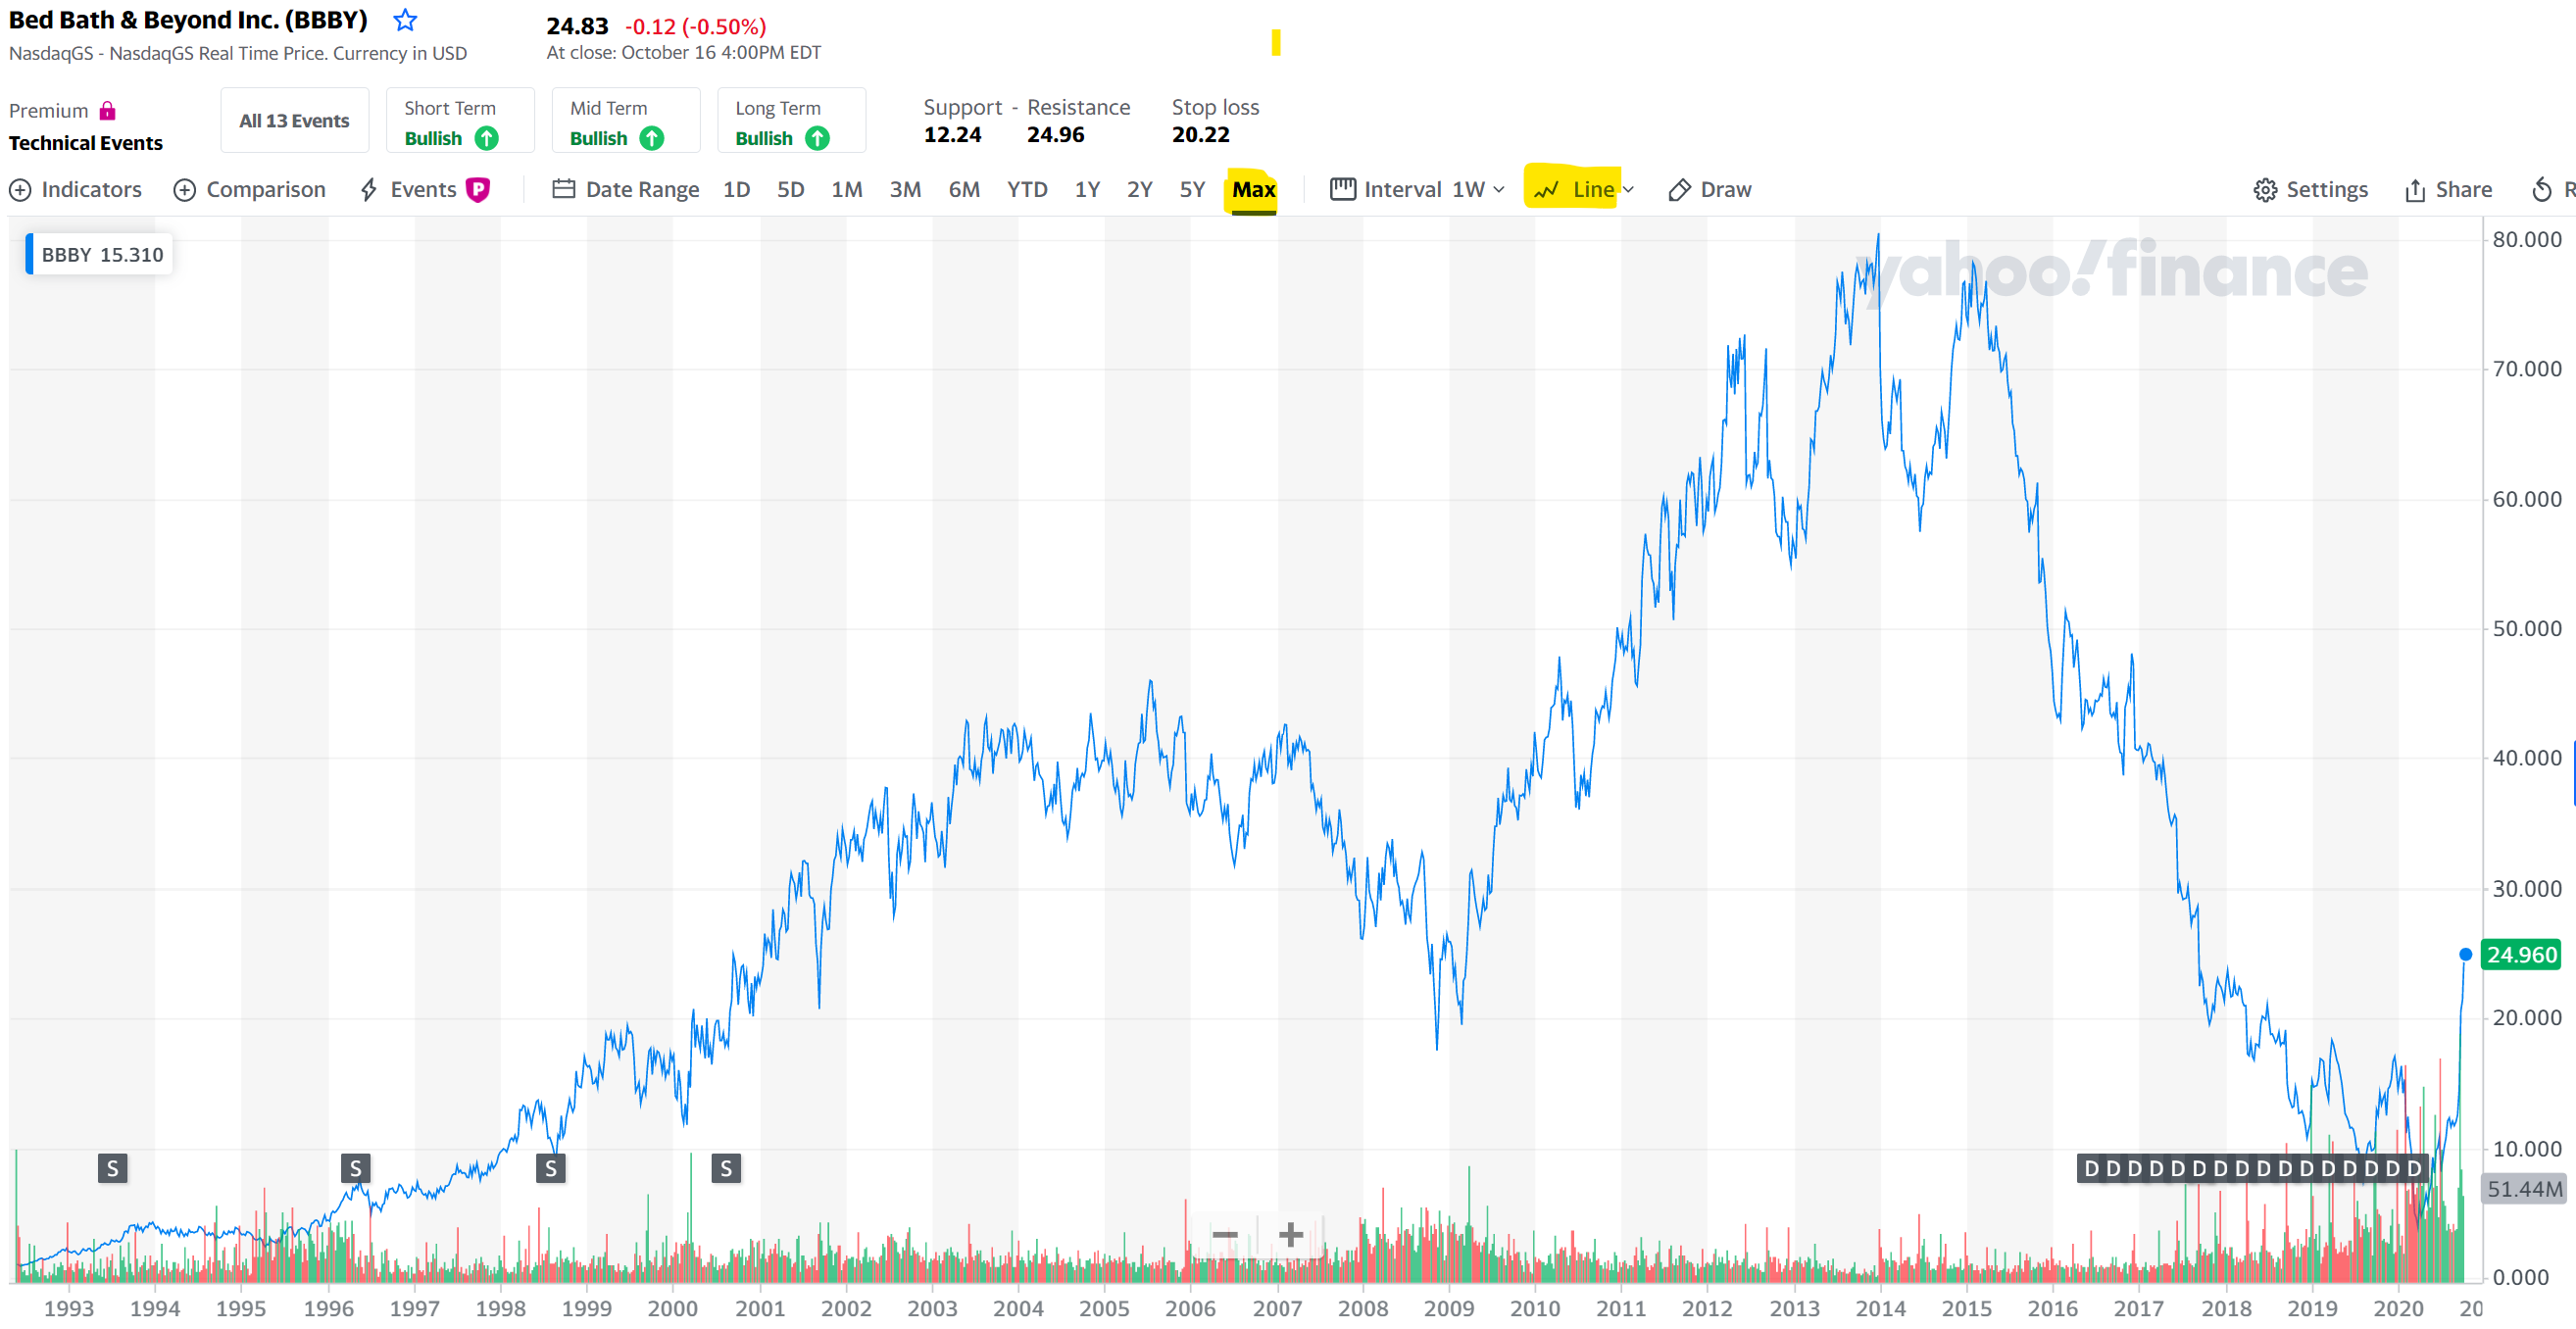
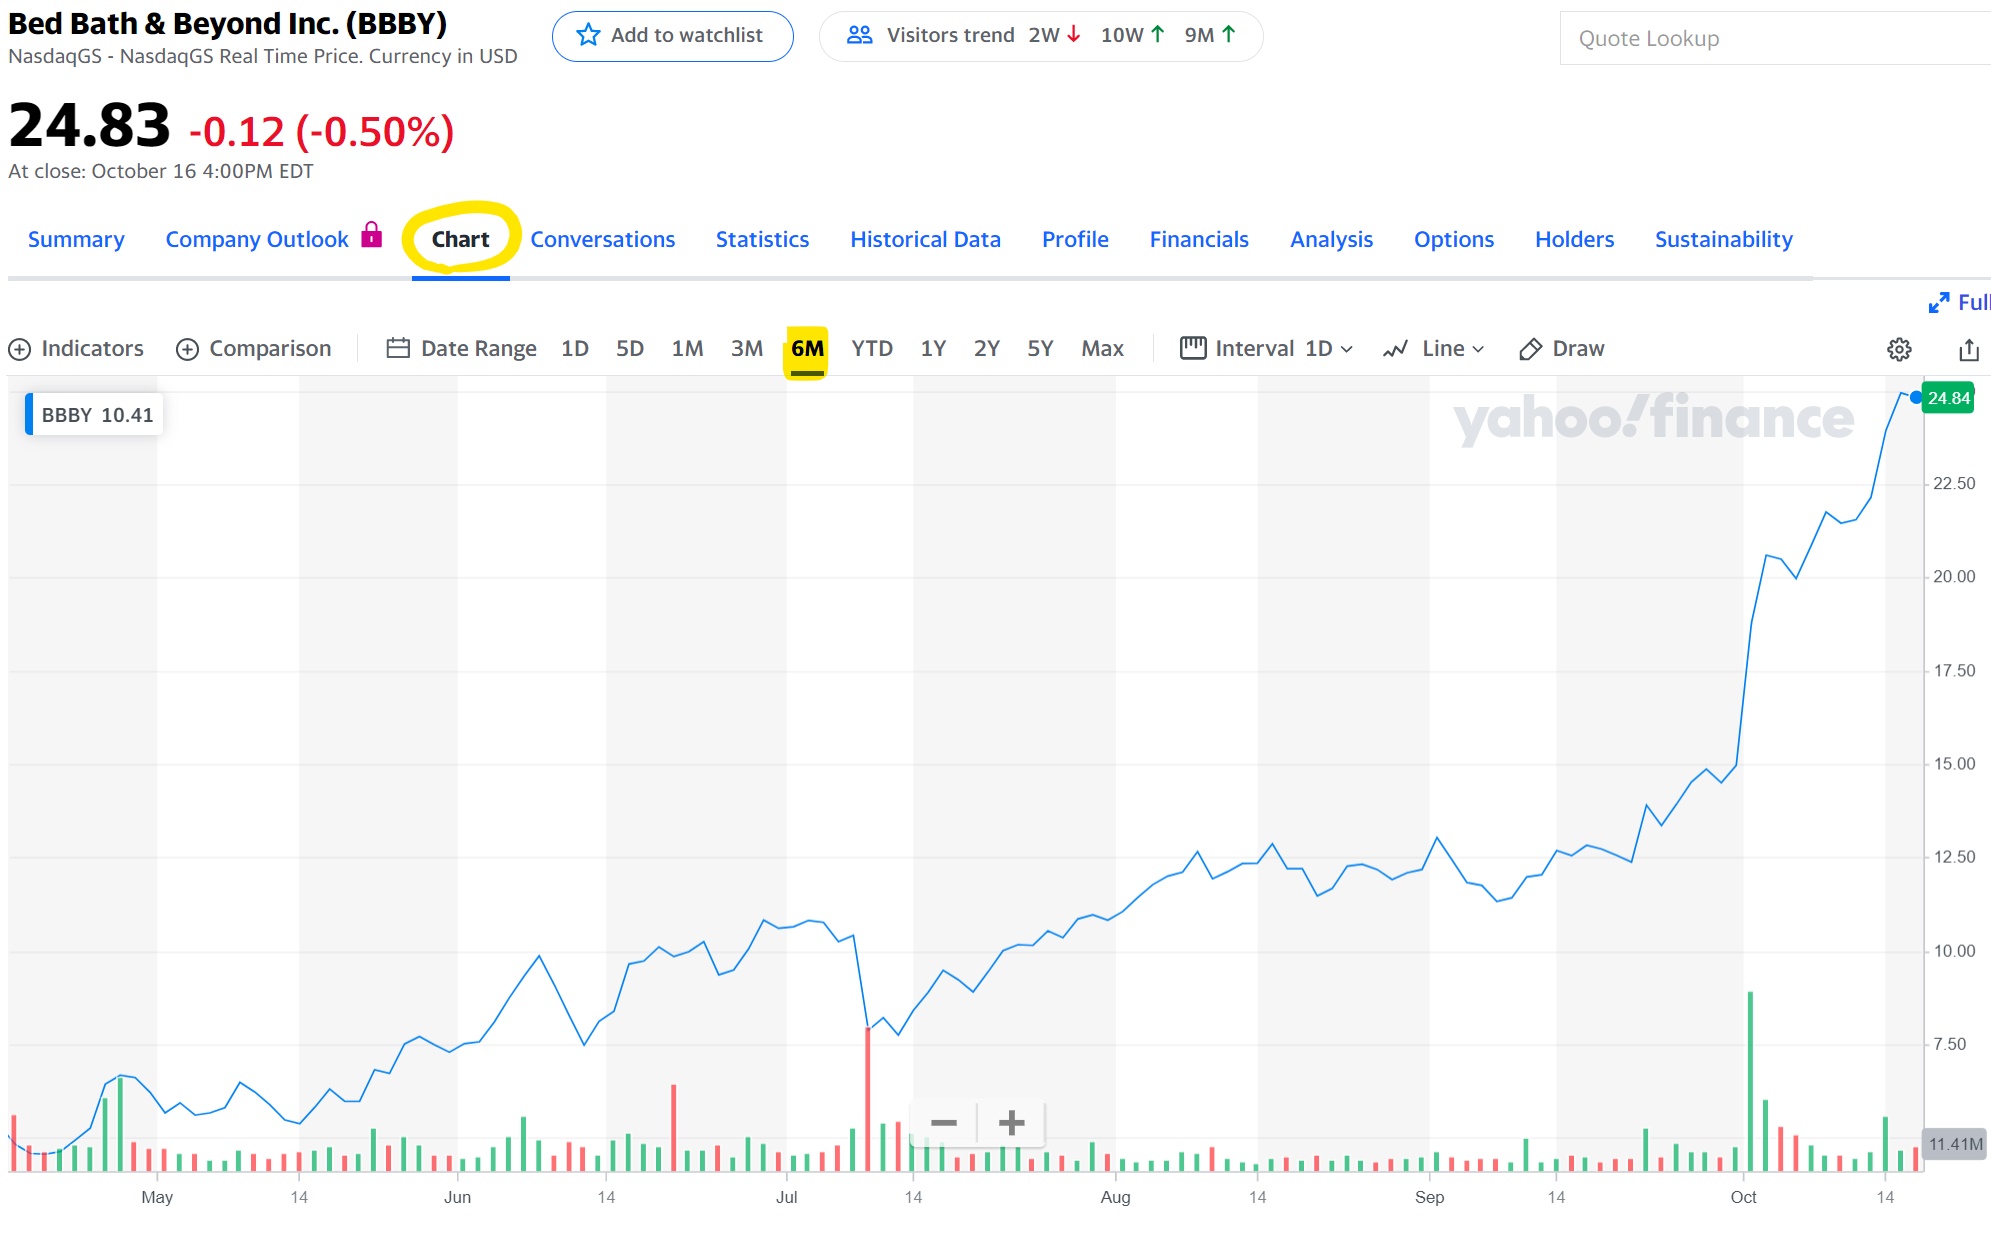
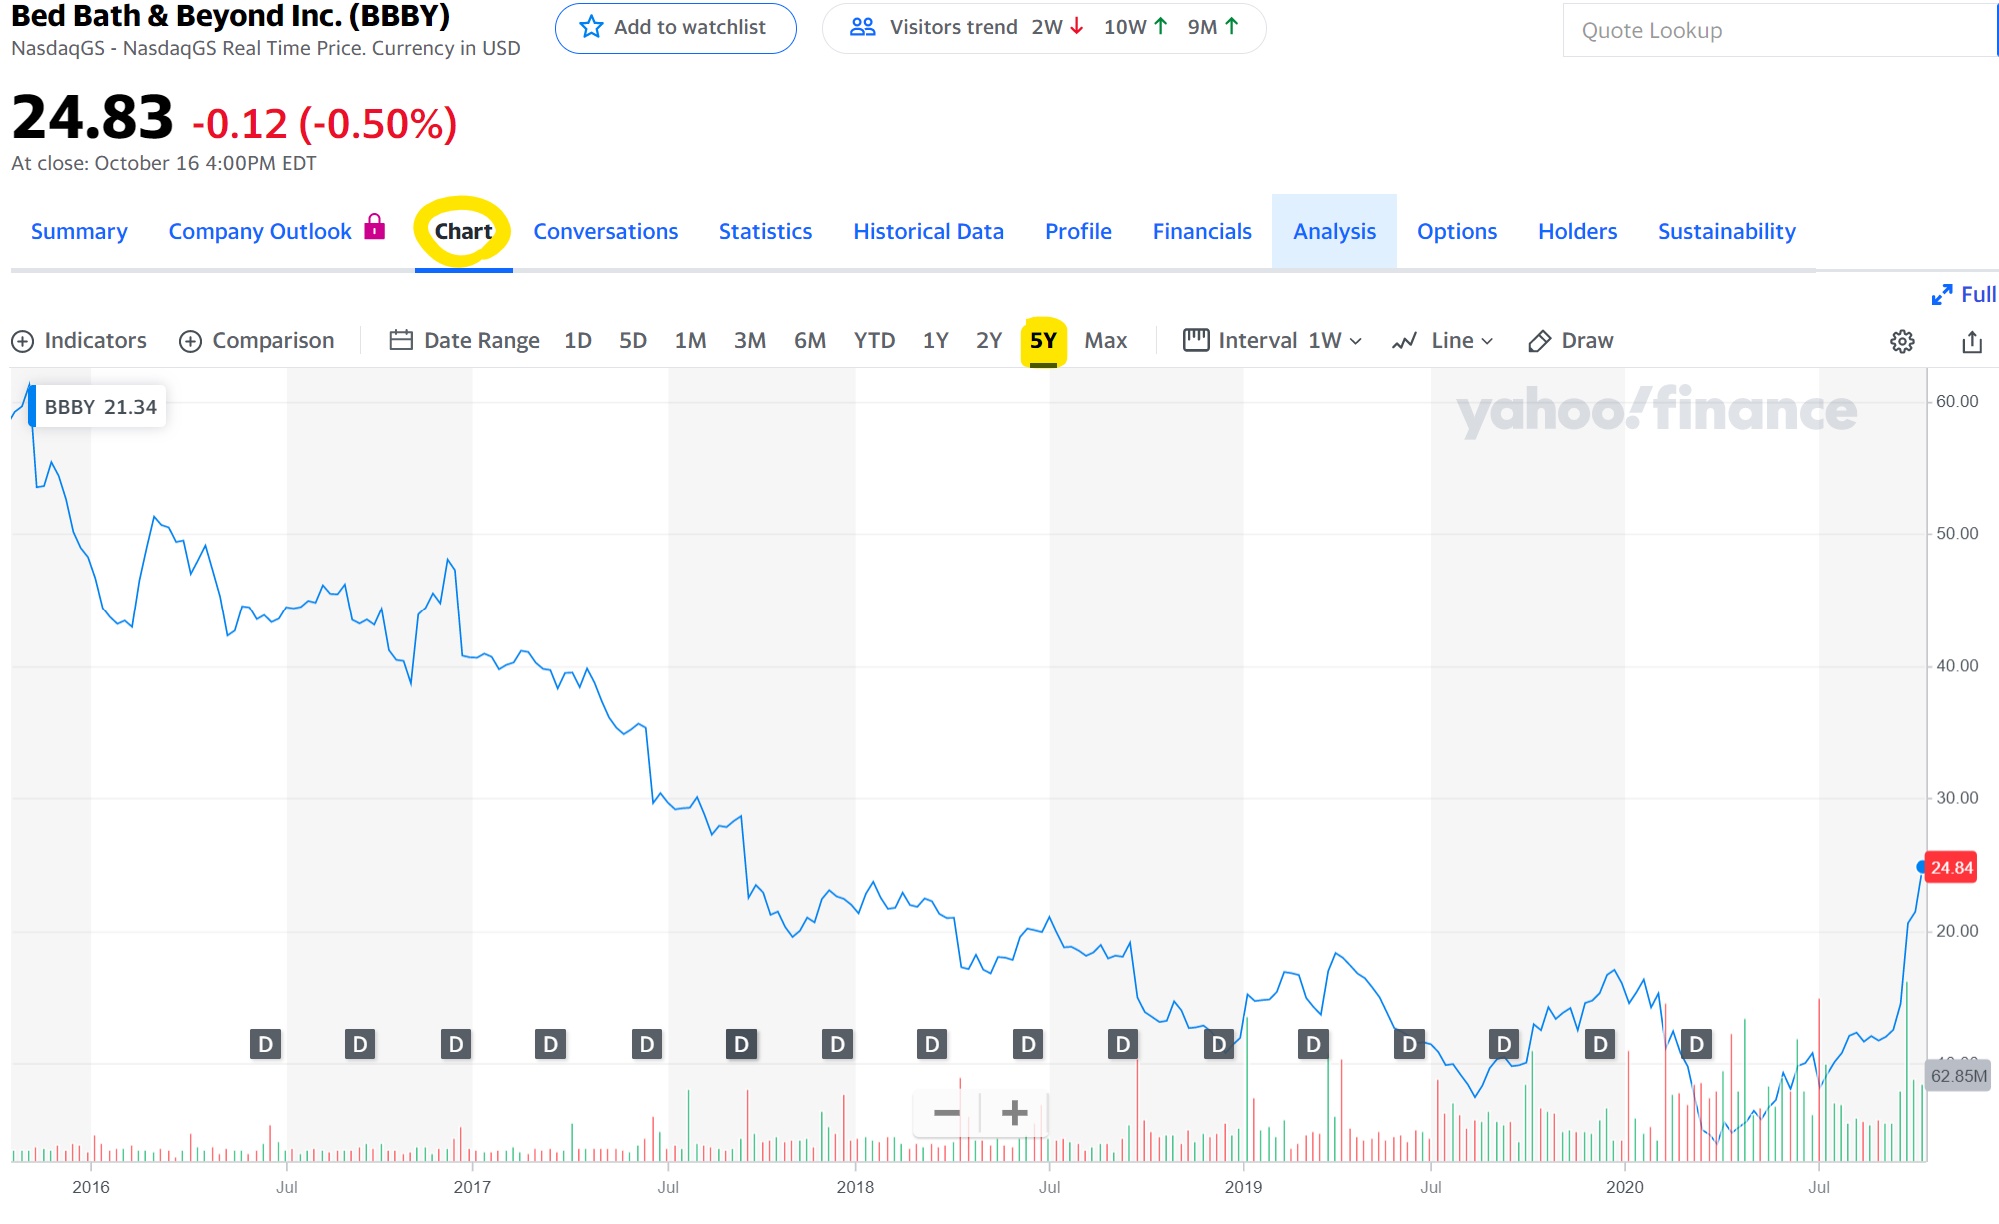
Bed Bath & Beyond Inc. (BBBY) 24.83 -0.12 (-0.50%) NasdaqGS - NasdaqGS Real Time Price. Currency in USD At close: October 16 4:00PM EDT Premium & All 13 Events Short Term Mid Term Long Term Support - Resistance Stop loss Technical Events Bullish T Bullish Bullish 12.24 24.96 20.22 Indicators + Comparison 4 Events P Date Range 10 5D 1M 3M 6M YTD 1Y 2Y 5Y Max Interval 1W W Line Draw Settings 1 Share BBBY 15.310 80.000 Wahoo! finance 70.000 60.000 50.000 40.000 30.000 24.960 20.000 S S S 10.000 DDDDDDDDDDDDDDDD 51.44M + 0.000 1993 1994 1995 1996 1997 1998 1999 2000 2001 2002 2003 2004 2005 2006 2007 2008 2009 2010 2011 2012 2013 2014 2015 2016 2017 2018 2019 2020 20Bed Bath & Beyond Inc. (BBBY) Add to watchlist 89 Visitors trend 2W | 10W T 9M T NasdaqGS - NasdaqGS Real Time Price. Currency in USD Quote Lookup 24.83 -0.12 (-0.50%) At close: October 16 4:00PM EDT Summary Company Outlook Chart Conversations Statistics Historical Data Profile Financials Analysis Options Holders Sustainability KFul Indicators Comparison Date Range 1D 5D 1M 3M 6M YTD 1Y 2Y 5Y Max ( Interval 1D W Line v Draw BBBY 10.41 yahoo! finance 24 84 22.50 20.00 17.50 15.00 12.50 10.00 -7.50 + 11.41M May 14 Jun 14 Jul 14 Aug 14 Sep 14 Oct 14Bed Bath & Beyond Inc. (BBBY) Add to watchlist 89 Visitors trend 2W | 10W T 9M T Quote Lookup NasdaqGS - NasdaqGS Real Time Price. Currency in USD 24.83 -0.12 (-0.50%) At close: October 16 4:00PM EDT Summary Company Outlook Chart Conversations Statistics Historical Data Profile Financials Analysis Options Holders Sustainability k Full Indicators Comparison Date Range 10 5D 1M 3M 6M YTD 1Y 2Y 5Y Max Interval 1W W Line Draw BBBY 21.34 yahoo!finance 60.00 50.00 40.00 30.00 24.84 20.00 D D D D D D D D D D D D D D D 62.85M + 2016 Jul 2017 Jul 2018 Jul 2019 Jul 2020 Jul
Step by Step Solution
There are 3 Steps involved in it

Get step-by-step solutions from verified subject matter experts