

Question: A small convenience store chain is interested in modeling the weekly sales of a store as a function of the weekly traffic flow on
![1) [1 mark] Identify the independent variable (x) and the dependent variable (y). Include the units. HINT: Which variable is](https://dsd5zvtm8ll6.cloudfront.net/si.experts.images/questions/2021/10/617bcd9fae8bd_1635546703099.jpg)
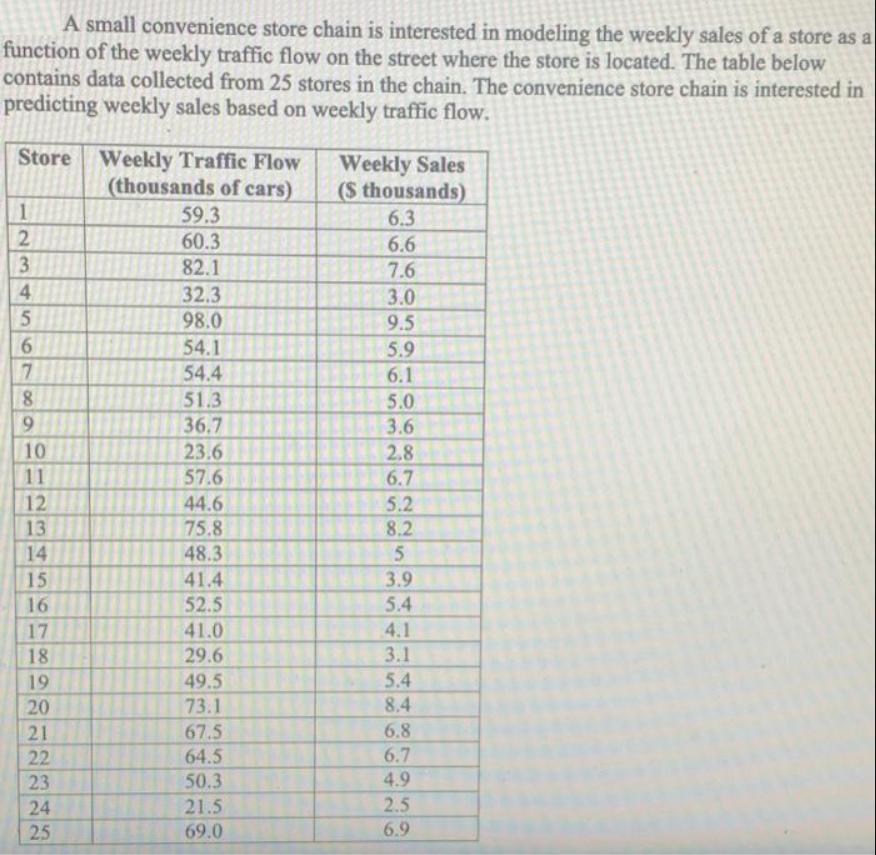
A small convenience store chain is interested in modeling the weekly sales of a store as a function of the weekly traffic flow on the street where the store is located. The table below contains data collected from 25 stores in the chain. The convenience store chain is interested in predicting weekly sales based on weekly traffic flow. Store Weekly Traffic Flow (thousands of cars) 59.3 60.3 Weekly Sales (S thousands) 6.3 6.6 3. 82.1 7.6 4 32.3 98.0 3.0 5. 9.5 6. 54.1 5.9 7 54.4 6.1 8 51.3 36.7 5.0 9. 3.6 10 23.6 2.8 11 57.6 6.7 12 44.6 75.8 5.2 8.2 13 14 48.3 3.9 5.4 15 41.4 16 52.5 41.0 4.1 3.1 17 18 29.6 19 49.5 5.4 20 73.1 8.4 6.8 67.5 64.5 21 22 6.7 23 50.3 4.9 24 21.5 2.5 25 69.0 6.9 1) [1 mark] Identify the independent variable (x) and the dependent variable (y). Include the units. HINT: Which variable is the one we want to predict? Is "the variable we want to predict" the independent or the dependent variable? One of the posted Example Videos will help. 2) [2 marks] Create an appropriate scatterplot using Excel. Label axes appropriately, and a provide an overall title. Save your scatterplot as an image and insert it into your Word file with your assignment answers. Do not submit your Excel file. Hand-drawn graphs will receive a grade of 0. Note ExampleVideo5, the video walkthrough of Example 7 from the Module 5 required reading, will help. 3) [7 marks] State the fitted regression equation. Do not use Excel, except to check your answer (do not submit any Excel content). Show: 1) the equation you use 2) how you plug in, and 3) your final answer, for each equation used. Round the sample covariance to 2 decimal places, and the fitted slope to 2 decimal places. Do not round any other values until you reach your final answer, then round each fitted coefficient to 2 decimal places. HINT: You are strongly encouraged to copy/paste from the Tutorial 5 Solutions document and modify the equations as necessary to save time. 4) [2 marks] Using your fitted regression line from question 3, calculate the residual for the first observation. Show 1) the equation you use, 2) how you plug in, and 3) your final answer, rounded to the nearest 2 decimal places. Explain what this value means, in this context, in one sentence.
Step by Step Solution
3.45 Rating (152 Votes )
There are 3 Steps involved in it
The response variable is y Weekly sales and the independent v... View full answer

Get step-by-step solutions from verified subject matter experts