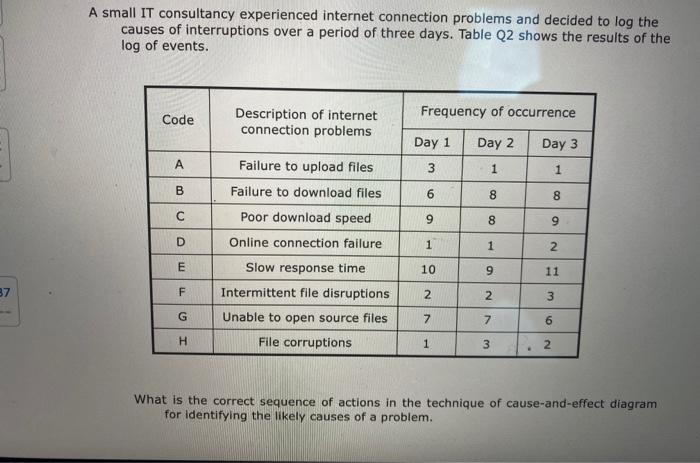
Question: A small IT consultancy experienced internet connection problems and decided to log the causes of interruptions over a period of three days. Table Q2 shows

A small IT consultancy experienced internet
A small IT consultancy experienced internet connection problems and decided to log the causes of interruptions over a period of three days. Table Q2 shows the results of the log of events. Frequency of occurrence Code Description of internet connection problems Day 1 Day 2 Day 3 A A 3 1 1 B 6 8 8 ca 9 8 9 D 1 1 N Failure to upload files Failure to download files Poor download speed Online connection failure Slow response time Intermittent file disruptions Unable to open source files File corruptions E 10 9 11 37 F 2 2 3 G 7 7 6 H 1 3 2 . What is the correct sequence of actions in the technique of cause-and-effect diagram for identifying the likely causes of a problem. Step 1: Identify the Problem Step 2: Work Out the Major Factors Involved Step 3: Identify Possible Causes Step 4: Analyze Your Diagram Step 1: Identify Possible Causes Step 2: Work Out the Major Factors Involved Step 3: Identify the Problem Step 4: Analyze Your Diagram Step 1: Identify the Problem Step 2: Analyze Your Diagram Step 3: Identify Possible Causes Step 4: Work Out the Major Factors Involved Step 1: Decide on Fishbone Step 2: 80 20 Rule Step 3: Apply Pareto Step 4: Prioritize

Step by Step Solution

There are 3 Steps involved in it

1 Expert Approved Answer
Step: 1 Unlock blur-text-image
Question Has Been Solved by an Expert!

Get step-by-step solutions from verified subject matter experts

Step: 2 Unlock
Step: 3 Unlock

Students Have Also Explored These Related General Management Questions!