

Question: A. State whether each raw score lies below the mean or above the mean. 1. X = 50 , s = 5, and x =


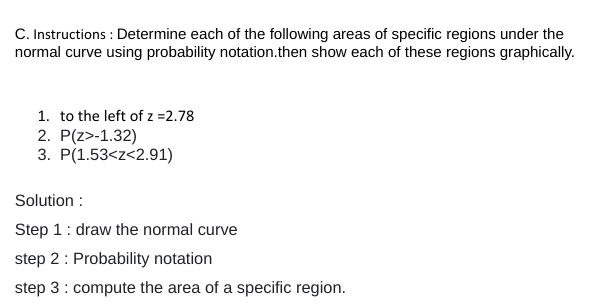
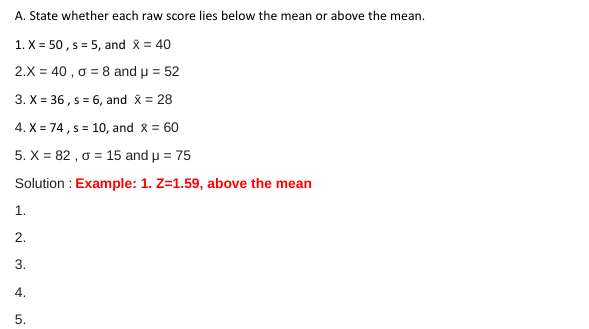
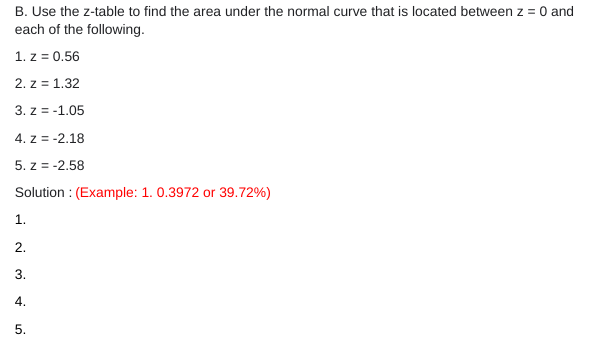

A. State whether each raw score lies below the mean or above the mean. 1. X = 50 , s = 5, and x = 40 2.X = 40 , o = 8 and u = 52 3. X = 36 , s = 6, and x = 28 4. X = 74 , s = 10, and * = 60 5. X = 82 , o = 15 and p = 75 Solution : Example: 1. Z=1.59, above the mean 1. 2. 4. 5.B. Use the z-table to find the area under the normal curve that is located between z = 0 and each of the following. 1. z = 0.56 2. Z = 1.32 3. z = -1.05 4. Z = -2.18 5. z = -2.58 Solution : (Example: 1. 0.3972 or 39.72%) 1. 2. 3. 4 5.C. Instructions : Determine each of the following areas of specific regions under the normal curve using probability notation.then show each of these regions graphically. 1. to the left of z =2.78 2. P(z>-1.32) 3. P(1.53
Step by Step Solution
There are 3 Steps involved in it

Get step-by-step solutions from verified subject matter experts