

Question: A statistical program is recommended. $308,000 in the first year of operation to $1,084,000 in the most recent year. The following data show the quarterly
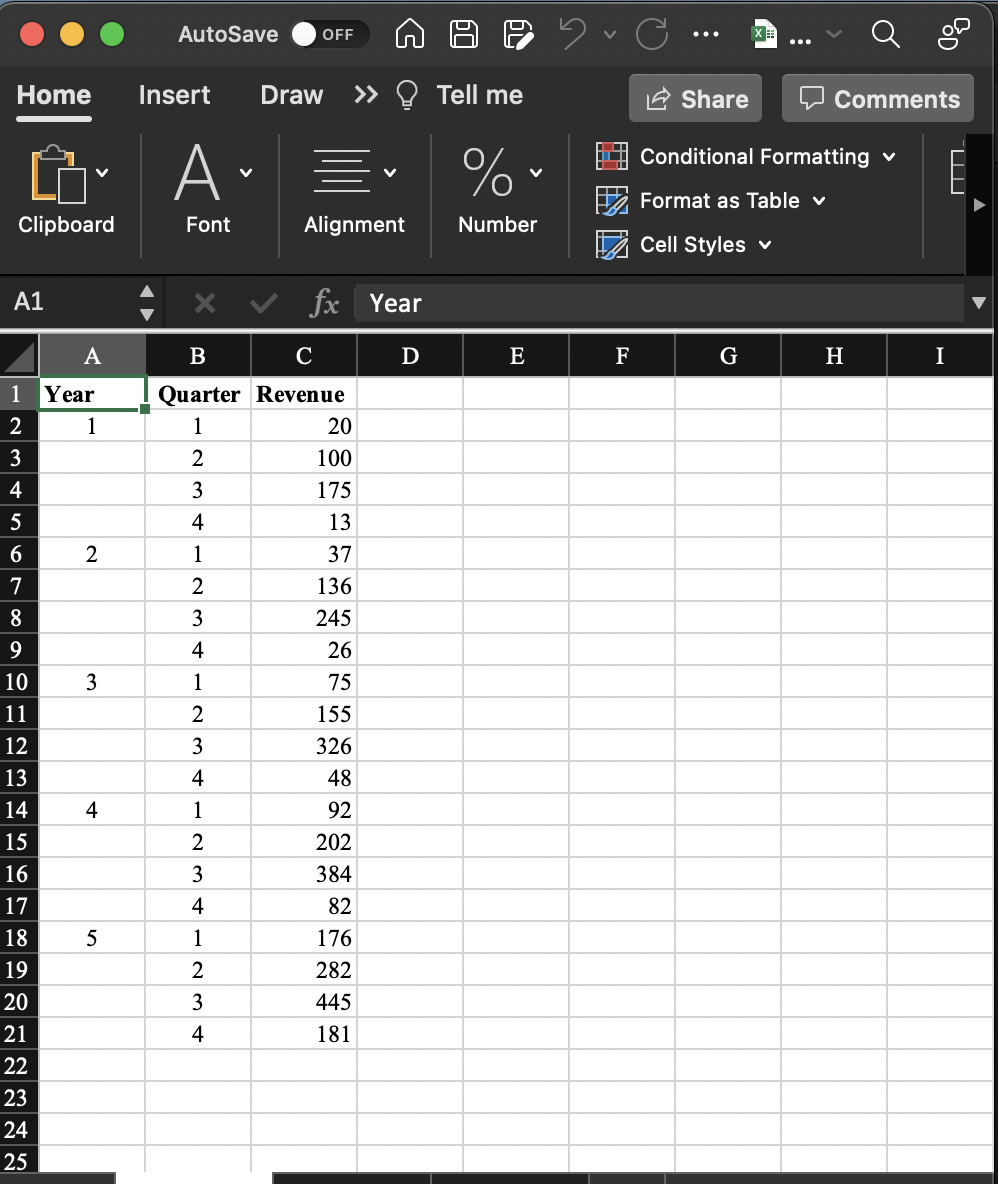
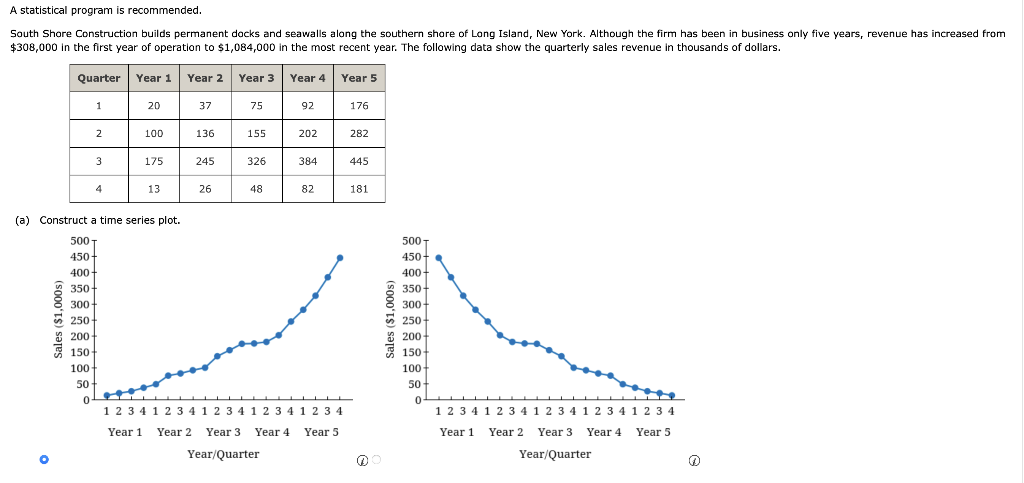
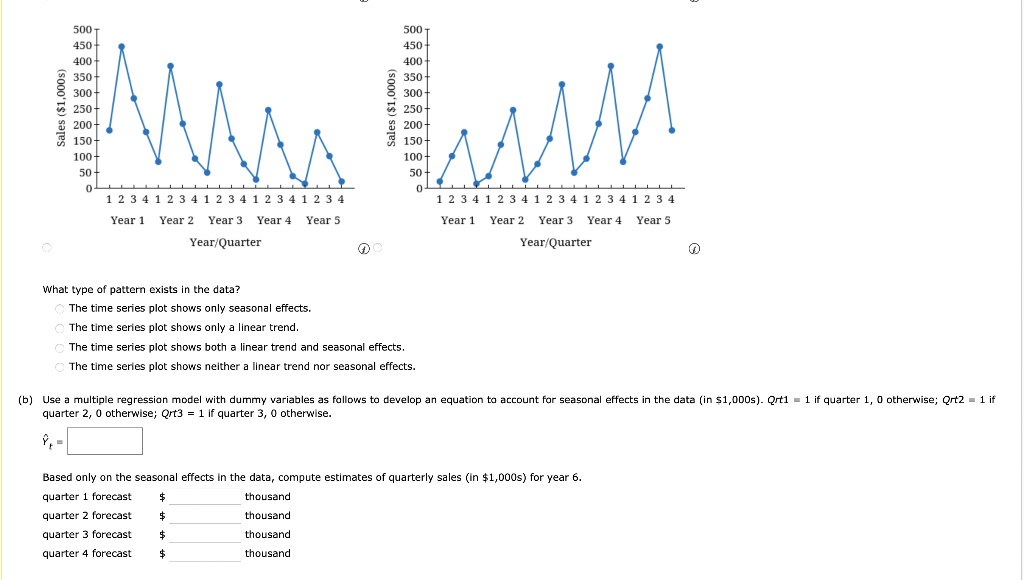
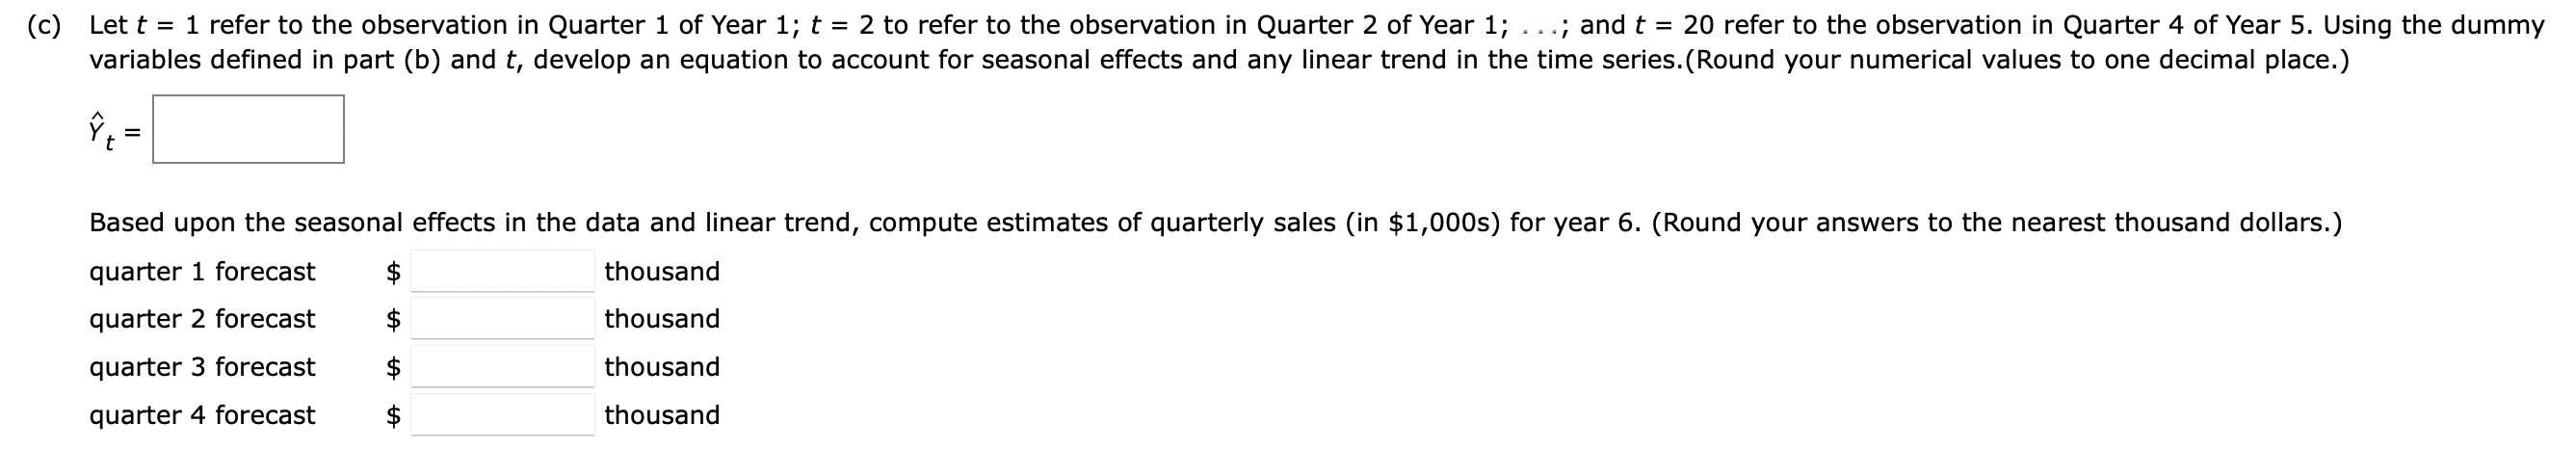
A statistical program is recommended. $308,000 in the first year of operation to $1,084,000 in the most recent year. The following data show the quarterly sales revenue in thousands of dollars. (a) Construct a time series plot. What type of pattern exists in the data? The time series plot shows only seasonal effects. The time series plot shows only a linear trend. The time series plot shows both a linear trend and seasonal effects. The time series plot shows neither a linear trend nor seasonal effects. quarter 2,0 otherwise; Qrt3=1 if quarter 3,0 otherwise. Y^t= Based only on the seasonal effects in the data, compute estimates of quarterly sales (in $1,000 ) for year 6. quarter 1 forecast t thousand quarter 2 forecast \$\$ thousand quarter 3 forecast $ thousand Y^t= quarter1forecastquarter2forecastquarter3forecastquarter4forecast$$$$thousandthousandthousandthousand A statistical program is recommended. $308,000 in the first year of operation to $1,084,000 in the most recent year. The following data show the quarterly sales revenue in thousands of dollars. (a) Construct a time series plot. What type of pattern exists in the data? The time series plot shows only seasonal effects. The time series plot shows only a linear trend. The time series plot shows both a linear trend and seasonal effects. The time series plot shows neither a linear trend nor seasonal effects. quarter 2,0 otherwise; Qrt3=1 if quarter 3,0 otherwise. Y^t= Based only on the seasonal effects in the data, compute estimates of quarterly sales (in $1,000 ) for year 6. quarter 1 forecast t thousand quarter 2 forecast \$\$ thousand quarter 3 forecast $ thousand Y^t= quarter1forecastquarter2forecastquarter3forecastquarter4forecast$$$$thousandthousandthousandthousand
Step by Step Solution
There are 3 Steps involved in it

Get step-by-step solutions from verified subject matter experts