

Question: A statistics student was interested in investigating the average time it takes to get a pizza delivered to their house from the local pizzeria.
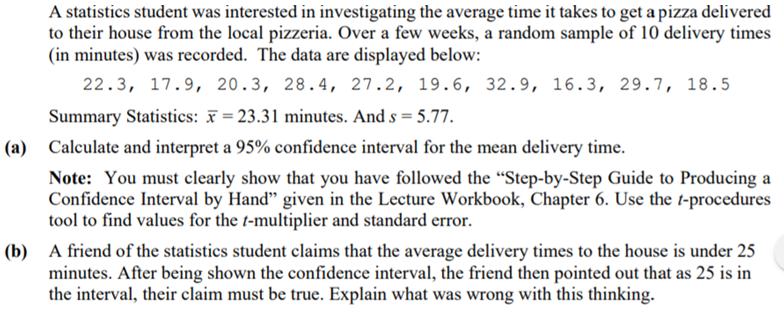
A statistics student was interested in investigating the average time it takes to get a pizza delivered to their house from the local pizzeria. Over a few weeks, a random sample of 10 delivery times (in minutes) was recorded. The data are displayed below: 22.3, 17.9, 20.3, 28.4, 27.2, 19.6, 32.9, 16.3, 29.7, 18.5 Summary Statistics: = 23.31 minutes. And s = 5.77. Calculate and interpret a 95% confidence interval for the mean delivery time. (a) Note: You must clearly show that you have followed the "Step-by-Step Guide to Producing a Confidence Interval by Hand" given in the Lecture Workbook, Chapter 6. Use the t-procedures tool to find values for the t-multiplier and standard error. A friend of the statistics student claims that the average delivery times to the house is under 25 minutes. After being shown the confidence interval, the friend then pointed out that as 25 is in the interval, their claim must be true. Explain what was wrong with this thinking. (b)
Step by Step Solution
3.31 Rating (151 Votes )
There are 3 Steps involved in it
To solve this problem lets tackle each part stepbystep a Calculate and interpret a 95 confidence int... View full answer

Get step-by-step solutions from verified subject matter experts