

Find and interpret a 95% confidence interval for the mean price of a home in California. Refer
Question:
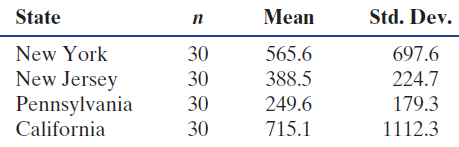
Refer to the dataset Homes For Sale, which has data on houses available for sale in three Mid-Atlantic states (NY, NJ, and PA) as well as California (CA). Table 6.17 has summary statistics for each of the four states, with prices given in thousands of dollars. (Since n = 30, we ask you to use the t-distribution here despite the fact that the data are quite skewed. In practice, we might have enough concern about the skewness to choose to use bootstrap methods instead.)
Table 6.17
Fantastic news! We've Found the answer you've been seeking!
Step by Step Answer:
For the confidence interval for a single mean in California we use The sample si...View the full answer

Answered By
Bhartendu Goyal
Professional, Experienced, and Expert tutor who will provide speedy and to-the-point solutions. I have been teaching students for 5 years now in different subjects and it's truly been one of the most rewarding experiences of my life. I have also done one-to-one tutoring with 100+ students and help them achieve great subject knowledge. I have expertise in computer subjects like C++, C, Java, and Python programming and other computer Science related fields. Many of my student's parents message me that your lessons improved their children's grades and this is the best only thing you want as a tea...
2+ Reviews
10+ Question Solved
Related Book For 

Statistics Unlocking The Power Of Data
ISBN: 9780470601877
1st Edition
Authors: Robin H. Lock, Patti Frazer Lock, Kari Lock Morgan, Eric F. Lock, Dennis F. Lock
Question Posted:
