

Question: A student used multiple regression analysis to study how Y is influenced by X1 and X2. The following results were obtained. SUMMARY OUTPUT Regression Statistics
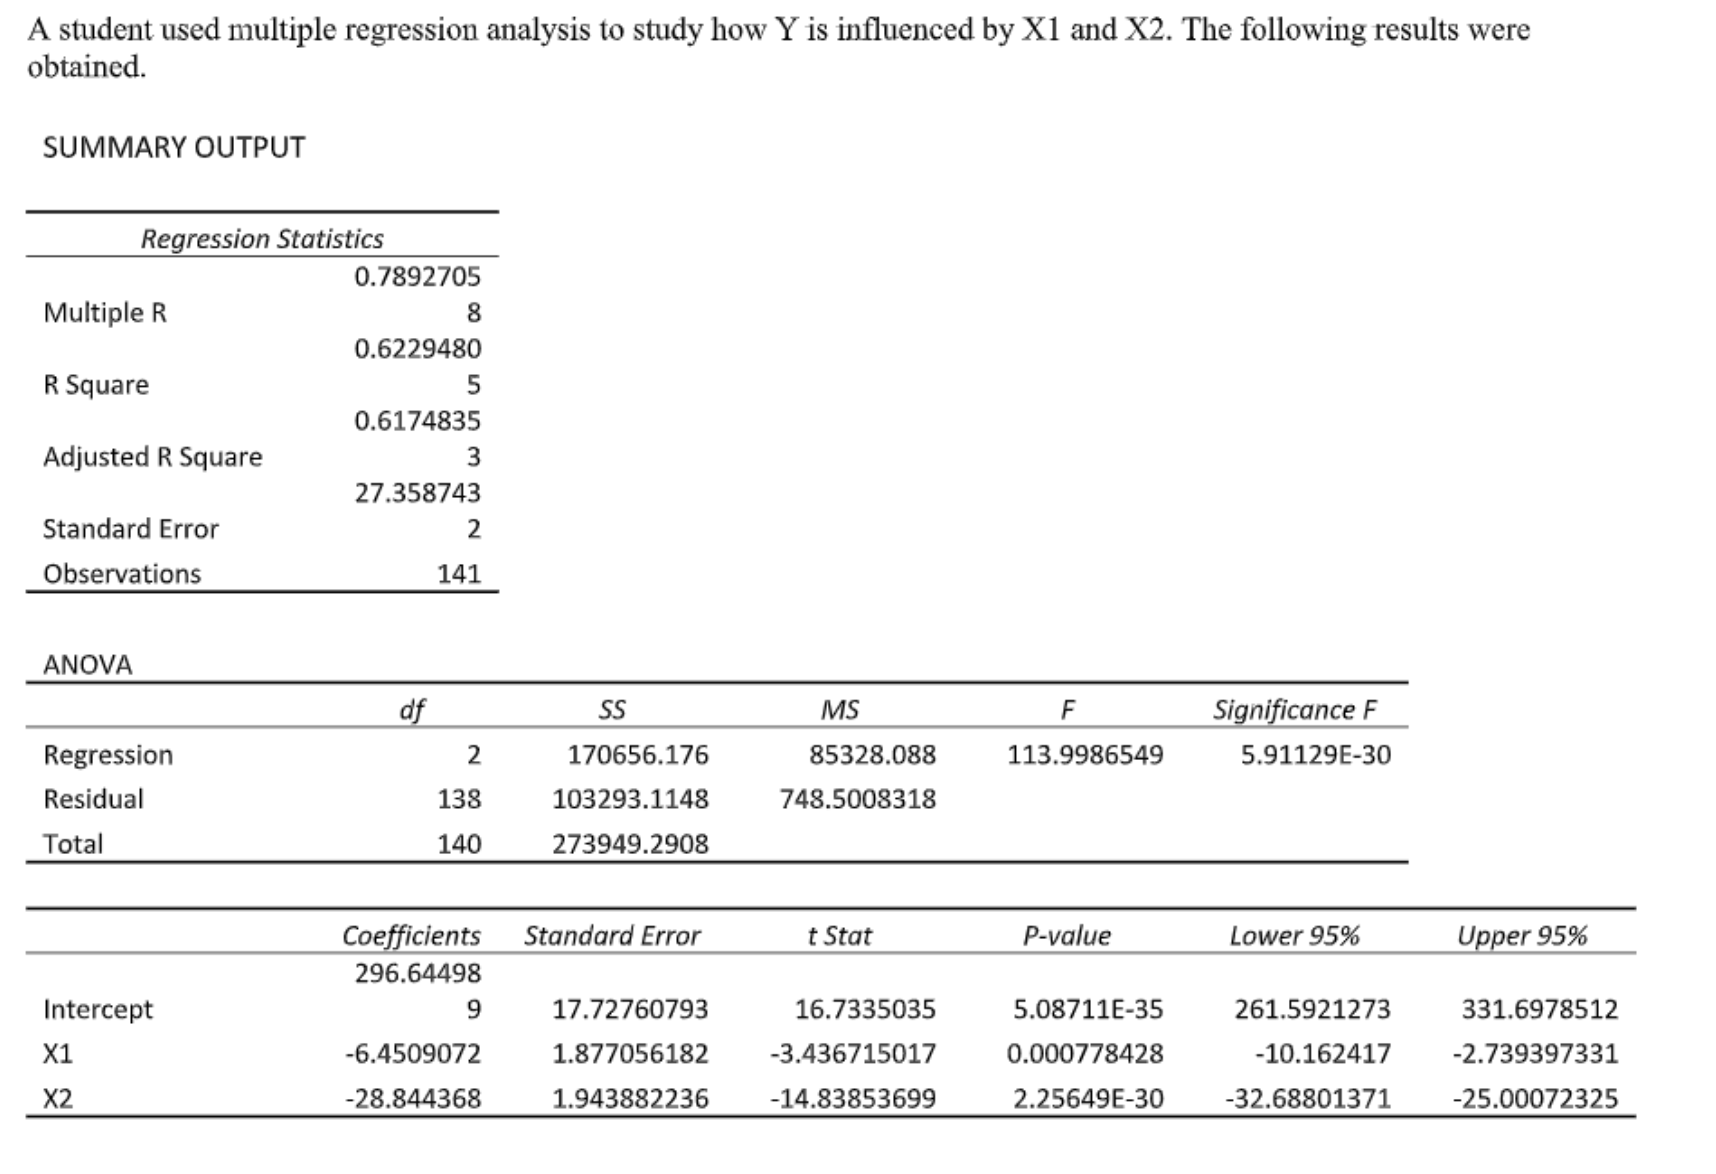
A student used multiple regression analysis to study how Y is influenced by X1 and X2. The following results were obtained. SUMMARY OUTPUT Regression Statistics 0.7892705 Multiple R 8 0.6229480 R Square 5 0.6174835 Adjusted R Square 3 27.358743 Standard Error 2 Observations 141 ANOVA of SS MS F Significance F Regression 2 170656.176 85328.088 113.9986549 5.91129E-30 Residual 138 103293.1148 748.5008318 Total 140 273949.2908 Coefficients Standard Error t Stat P-value Lower 95% Upper 95% 296.64498 Intercept 9 17.72760793 16.7335035 5.08711E-35 261.5921273 331.6978512 X1 -6.4509072 1.877056182 -3.436715017 0.000778428 -10.162417 -2.739397331 X2 -28.844368 1.943882236 -14.83853699 2.25649E-30 -32.68801371 -25.00072325
Step by Step Solution
There are 3 Steps involved in it

Get step-by-step solutions from verified subject matter experts