

Question: A study compared the amount of protein per serving in grams in two varieties of green peas, with one plant of each variety variety of
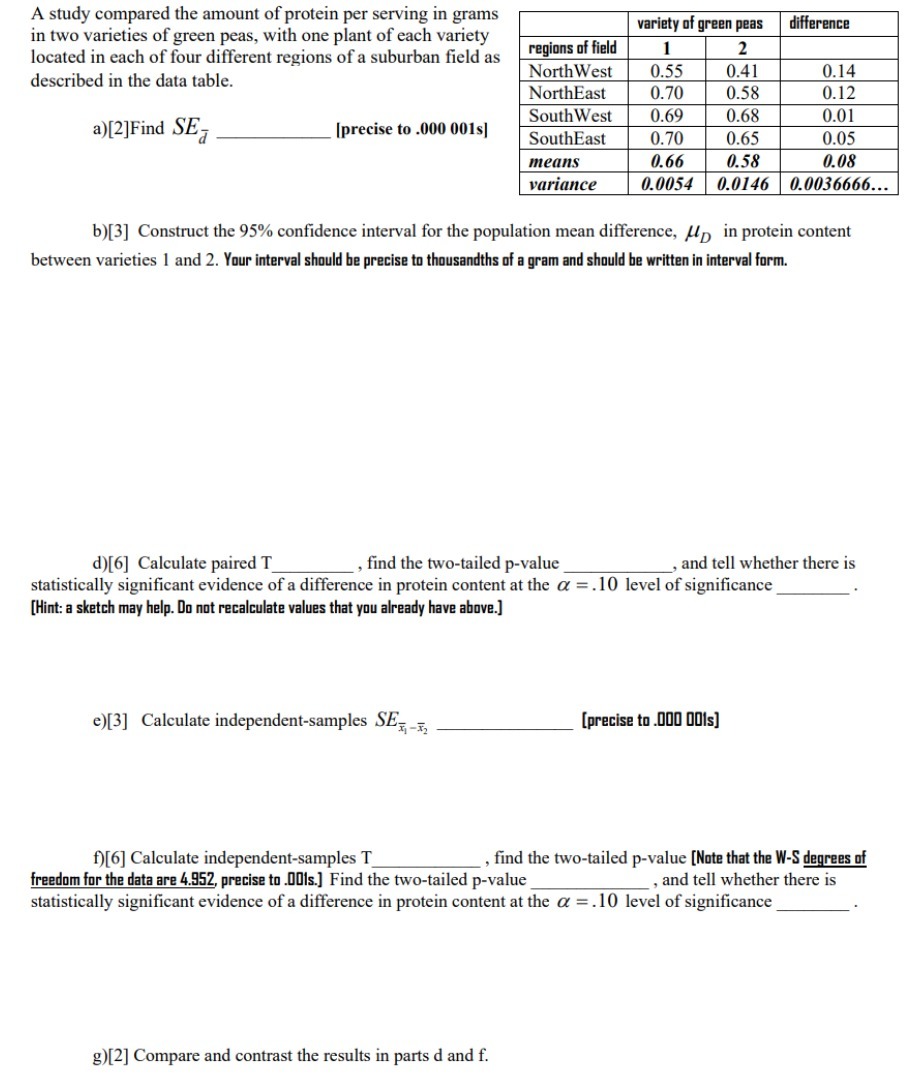
A study compared the amount of protein per serving in grams in two varieties of green peas, with one plant of each variety variety of green peas difference located in each of four different regions of a suburban field as regions of field described in the data table. North West 0.55 0.41 0.14 NorthEast 0.70 0.58 0.12 a)[2]Find SE [precise to .000 001s] South West 0.69 0.68 0.01 SouthEast 0.70 0.65 0.05 means 0.66 0.58 0.08 variance 0.0054 0.0146 0.0036666... b)[3] Construct the 95% confidence interval for the population mean difference, / in protein content between varieties 1 and 2. Your interval should be precise to thousandths of a gram and should be written in interval form. d)[6] Calculate paired T_ , find the two-tailed p-value , and tell whether there is statistically significant evidence of a difference in protein content at the o = . 10 level of significance [Hint: a sketch may help. Do not recalculate values that you already have above.] e)[3] Calculate independent-samples SE, -, [precise to .000 001s] f)[6] Calculate independent-samples T_ freedom for the data are 4.952, precise to .001s.] Find the two-tailed p-value find the two-tailed p-value [Note that the W-S degrees of , and tell whether there is statistically significant evidence of a difference in protein content at the o = .10 level of significance g)[2] Compare and contrast the results in parts d and f
Step by Step Solution
There are 3 Steps involved in it

Get step-by-step solutions from verified subject matter experts