Question: A study investigated the relationship between audit delay (the length of time from a company's fiscal year-end to the date of the auditor's report) and
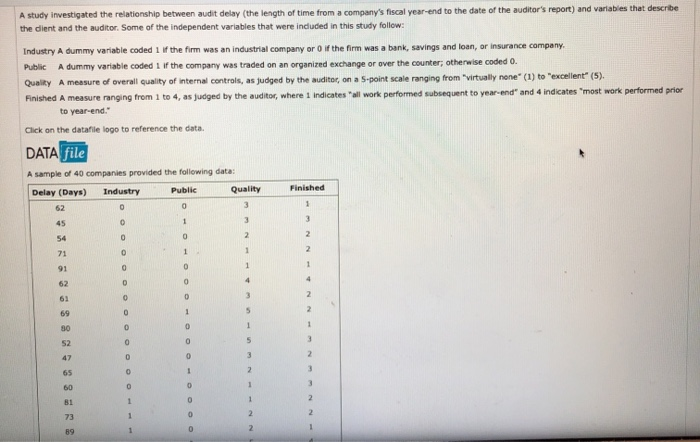
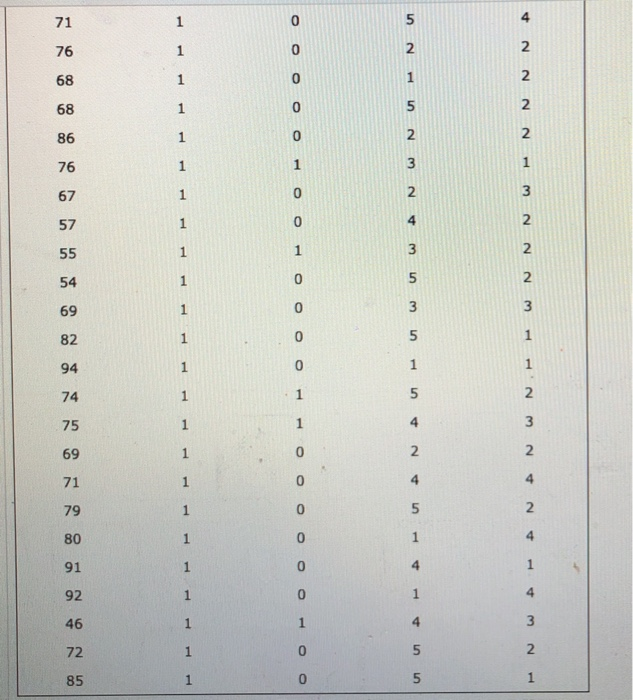
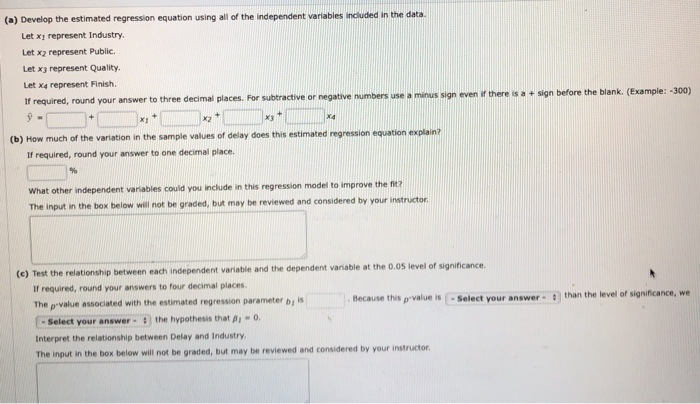
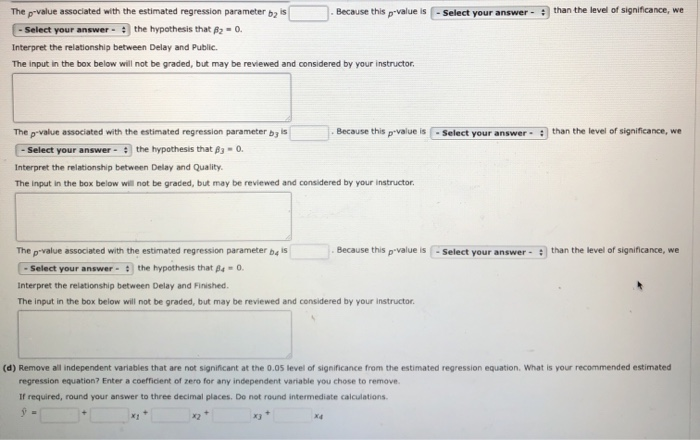
A study investigated the relationship between audit delay (the length of time from a company's fiscal year-end to the date of the auditor's report) and variables that describe the dient and the auditor. Some of the independent variables that were included in this study follow: Industry A dummy variable coded 1 If the firm was an industrial company or if the firm was a bank, savings and loan, or insurance company Public Adummy variable coded 1 if the company was traded on an organired exchange or over the counter; otherwise coded 0. Quality A measure of overall quality of internal controls, as judged by the auditor, on a 5-point scale ranging from "virtually none" (1) to "excellent" (5). Finished A measure ranging from 1 to 4, as judged by the auditor, where 1 indicates all work performed subsequent to year-end" and 4 indicates most work performed prior to year-end." Click on the datafile logo to reference the date. DATA file A sample of 40 companies provided the following data: Delay (Days) Industry Public Quality Finished 1 62 0 0 3 3 1 45 3 54 0 0 2 2 0 1 1 71 2 91 0 0 1 1 62 4 D 4 61 0 0 2 2 69 0 1 5 30 0 0 1 1 0 5 3 52 0 47 O 2 3 65 0 1 2 1 60 0 3 0 81 1 0 2 1 2 1 O 73 2 1 89 1 2 0 71 1 5 5 4 76 2 2 68 1 1 2 68 1 5 2 86 1 0 2 2 76 1 1 3 1 67 1 0 2 3 57 1 0 4 2 2 55 1 3 2 54 1 0 5 2 69 1 0 3 3 82 1 0 5 94 1 0 1 1 74 1 1 5 2 75 1 o ANA U Nw 69 1 71 1 4 79 1 0 5 2. 80 1 0 1 4 91 1 0 4 1 92 1 0 1 4 46 1 4 72 1 5 85 1 5 1 (a) Develop the estimated regression equation using all of the independent variables included in the data. Let xi represent Industry, Let x2 represent Public. Let x3 represent Quality Let x4 represent Finish If required, round your answer to three decimal places. For subtractive or negative numbers use a minus sign even if there is a sign before the blank. (Example: -300) x, X2 X3 (b) How much of the variation in the sample values of delay does this estimated regression equation explain? If required, round your answer to one decimal place. + + xa What other independent variables could you include in this regression model to improve the fit? The input in the box below will not be graded, but may be reviewed and considered by your instructor (c) Test the relationship between each independent variable and the dependent variable at the 0.05 level of significance If required, round your answers to four decimal places The p-value associated with the estimated regression parameter bis Because this p value is Select your answer than the level of significance, we - Select your answer the hypothesis that -0. Interpret the relationship between Delay and Industry The input in the box below will not be graded, but may be reviewed and considered by your instructor 52 is than the level of significance, we The p-value associated with the estimated regression parameter Because this p-value is - Select your answer - Select your answer the hypothesis that B2 - 0. Interpret the relationship between Delay and Public. The input in the box below will not be graded, but may be reviewed and considered by your instructor. Select your answer than the level of significance, we The p-value associated with the estimated regression parameter by is Because this pvalue is Select your answer the hypothesis that B, -0. Interpret the relationship between Delay and Quality The input in the box below will not be graded, but may be reviewed and considered by your instructor Select your answer than the level of significance, we The p-value associated with the estimated regression parameter beis Because this p value is - Select your answer the hypothesis that Be - 0. Interpret the relationship between Delay and Finished. The input in the box below will not be graded, but may be reviewed and considered by your instructor. (d) Remove all independent variables that are not significant at the 0.05 level of significance from the estimated regression equation. What is your recommended estimated regression equation? Enter a coefficient of zero for any independent variable you chose to remove If required, round your answer to three decimal places. Do not round intermediate calculations x A study investigated the relationship between audit delay (the length of time from a company's fiscal year-end to the date of the auditor's report) and variables that describe the dient and the auditor. Some of the independent variables that were included in this study follow: Industry A dummy variable coded 1 If the firm was an industrial company or if the firm was a bank, savings and loan, or insurance company Public Adummy variable coded 1 if the company was traded on an organired exchange or over the counter; otherwise coded 0. Quality A measure of overall quality of internal controls, as judged by the auditor, on a 5-point scale ranging from "virtually none" (1) to "excellent" (5). Finished A measure ranging from 1 to 4, as judged by the auditor, where 1 indicates all work performed subsequent to year-end" and 4 indicates most work performed prior to year-end." Click on the datafile logo to reference the date. DATA file A sample of 40 companies provided the following data: Delay (Days) Industry Public Quality Finished 1 62 0 0 3 3 1 45 3 54 0 0 2 2 0 1 1 71 2 91 0 0 1 1 62 4 D 4 61 0 0 2 2 69 0 1 5 30 0 0 1 1 0 5 3 52 0 47 O 2 3 65 0 1 2 1 60 0 3 0 81 1 0 2 1 2 1 O 73 2 1 89 1 2 0 71 1 5 5 4 76 2 2 68 1 1 2 68 1 5 2 86 1 0 2 2 76 1 1 3 1 67 1 0 2 3 57 1 0 4 2 2 55 1 3 2 54 1 0 5 2 69 1 0 3 3 82 1 0 5 94 1 0 1 1 74 1 1 5 2 75 1 o ANA U Nw 69 1 71 1 4 79 1 0 5 2. 80 1 0 1 4 91 1 0 4 1 92 1 0 1 4 46 1 4 72 1 5 85 1 5 1 (a) Develop the estimated regression equation using all of the independent variables included in the data. Let xi represent Industry, Let x2 represent Public. Let x3 represent Quality Let x4 represent Finish If required, round your answer to three decimal places. For subtractive or negative numbers use a minus sign even if there is a sign before the blank. (Example: -300) x, X2 X3 (b) How much of the variation in the sample values of delay does this estimated regression equation explain? If required, round your answer to one decimal place. + + xa What other independent variables could you include in this regression model to improve the fit? The input in the box below will not be graded, but may be reviewed and considered by your instructor (c) Test the relationship between each independent variable and the dependent variable at the 0.05 level of significance If required, round your answers to four decimal places The p-value associated with the estimated regression parameter bis Because this p value is Select your answer than the level of significance, we - Select your answer the hypothesis that -0. Interpret the relationship between Delay and Industry The input in the box below will not be graded, but may be reviewed and considered by your instructor 52 is than the level of significance, we The p-value associated with the estimated regression parameter Because this p-value is - Select your answer - Select your answer the hypothesis that B2 - 0. Interpret the relationship between Delay and Public. The input in the box below will not be graded, but may be reviewed and considered by your instructor. Select your answer than the level of significance, we The p-value associated with the estimated regression parameter by is Because this pvalue is Select your answer the hypothesis that B, -0. Interpret the relationship between Delay and Quality The input in the box below will not be graded, but may be reviewed and considered by your instructor Select your answer than the level of significance, we The p-value associated with the estimated regression parameter beis Because this p value is - Select your answer the hypothesis that Be - 0. Interpret the relationship between Delay and Finished. The input in the box below will not be graded, but may be reviewed and considered by your instructor. (d) Remove all independent variables that are not significant at the 0.05 level of significance from the estimated regression equation. What is your recommended estimated regression equation? Enter a coefficient of zero for any independent variable you chose to remove If required, round your answer to three decimal places. Do not round intermediate calculations x