

Question: A study investigated the relationship between audit delay (the length of time from a company's fiscal year-end to the date of the auditor's report) and
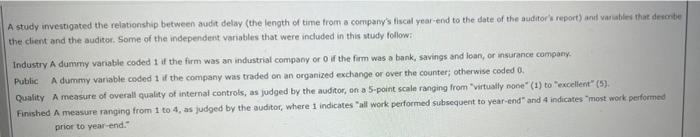
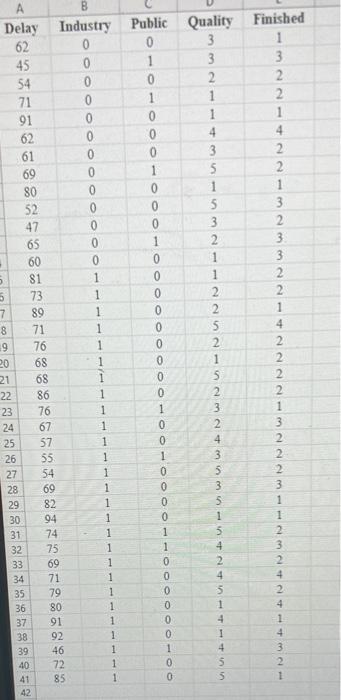
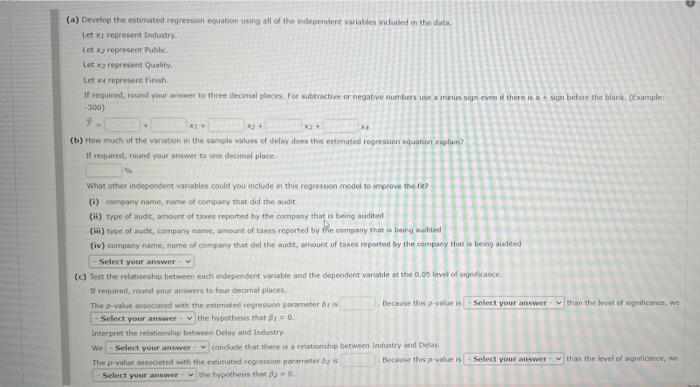
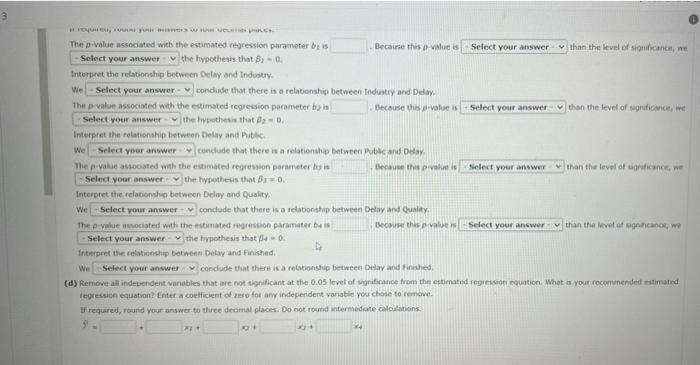
A study investigated the relationship between audit delay (the length of time from a company's fiscal year-end to the date of the auditor's report) and variables that describe the client and the auditor. Some of the independent variables that were included in this study follow: Industry A dummy variable coded 1 if the firm was an industrial company or 0 if the firm was a bank, savings and loan, or insurance company. Public A dummy variable coded 1 if the company was traded on an organized exchange or over the counter; otherwise coded 0. Quality A measure of overall quality of internal controls, as judged by the auditor, on a 5-point scale ranging from "virtually none" (1) to "excellent" (5). Finished A measure ranging from 1 to 4, as judged by the auditor, where 1 indicates "all work performed subsequent to year-end" and 4 indicates "most work performed prior to year-end." Delay 62 45 54 71 91 62 5 5 7 61 69 80 52 47 65 60 81 73 89 71 8 9 20 21 22 23 24 25 26 27 28 29 82 30 31 32 33 35 36 76 68 68 86 76 67 57 55 54 69 B Industry 0 0 34 71 79 80 91 40 41 42 94 74 75 69 37 38 92 39 46 72 85 0 0 0 0 0 0 0 0 0 0 1 1 1 1 1 1 1 1 1 1 1 1 1 1 1 1 1 1 1 1 1 1 1 1 1 1 Public 0 1 0 1 0 0 1 0 0 0 0 0 0 0 0 0 0 0 1 0 0 1000100 0 0 0 0 0 0100 Quality 332 2 1 1 4 3 5 1 5 3 2 1 1 2 2 2 1 523NIMISM5-SINTSITI455 1 1 Finished 1 3 2 2 1 4 2 2 1 3 2 3. 3 2 2 1 4 2 2 2 1213NNNMAINSAINT-T321 4 4 4 (a) Develop the estimated regression equation using all of the independent variables included in the data, i Let x; represent Industry. Let x2 represent Public Let xa represent Quality Let xa represent Finish. If required, round your answer to three decanal places. For subtractive or negative numbers use a manus sign even if there is a sign before the blank. (Example: -300) (b) How much of the variation in the sample values of delay does this estimated regression equation explain? If required, round your answer to one decimal place. What other independent variables could you include in this regression model to improve the fie? (i) company name, name of company that did the audit (ii) type of audit, amount of taxes reported by the company that is being audited (mi) type of audit, company name, amount of taxes reported by the company that is being audited (iv) company name, name of company that did the audit, amount of taxes reported by the company that is being audited Select your answer (c) Test the relationship between each independent variable and the dependent variable at the 0.05 level of significance If required, round your answers to four decimal places. The p-value associated with the estimated regression parameter by Select your answer the hypothesis that = 0. Interpret the relationship between Delay and Industry. We Select your answer conclude that there is a relationship between Industry and Delay The p-value associated with the estimated regression parameter by s Because this p-value is Select your answer the hypothesis that -0. Because this p-value is Select your answer than the level of significance, we Select your answer than the level of significance, we Foires, ou pour mistr w o veci proces The p-value associated with the estimated regression parameter b; is Select your answer the hypothesis that 81-0. Interpret the relationship between Delay and Industry. We Select your answer conclude that there is a relationship between Industry and Delay The p-value associated with the estimated regression parameter by is Because this p-value is Select your answer the hypothesis that 2-0. Interpret the relationship between Delay and Public. We Select your answer conclude that there is a relationship between The p-value associated with the estimated regression parameter by is Select your answer the hypothesis that Ba=0. Interpret the relationship between Delay and Quality, We-Select your answer conclude that there is a relationship between Because this p-value is 724 8+ Select your answer than the level of significance, we If required, round your answer to three deomal places. Do not round intermediate calculations. 9 X24 Select your answer Public and Delay Because this p-value is Select your answer than the level of significance, we The p-value associated with the estimated regression parameter be is Select your answer the hypothesis that 04-0. Interpret the relationship between Delay and Finished. We Select your answer conclude that there is a relationship between Delay and Finished, (d) Remove all independent variables that are not significant at the 0.05 level of significance from the estimated regression equation. What is your recommended estimated regression equation? Enter a coefficient of zero for any independent variable you chose to remove. than the level of significance, we Delay and Quality Because this p-values Select your answer than the level of signincanor, we
Step by Step Solution
There are 3 Steps involved in it

Get step-by-step solutions from verified subject matter experts