

Question: A study is interested in assessing whether there is a linear relationship between the distance traveled with a gallon of fuel and the weight of
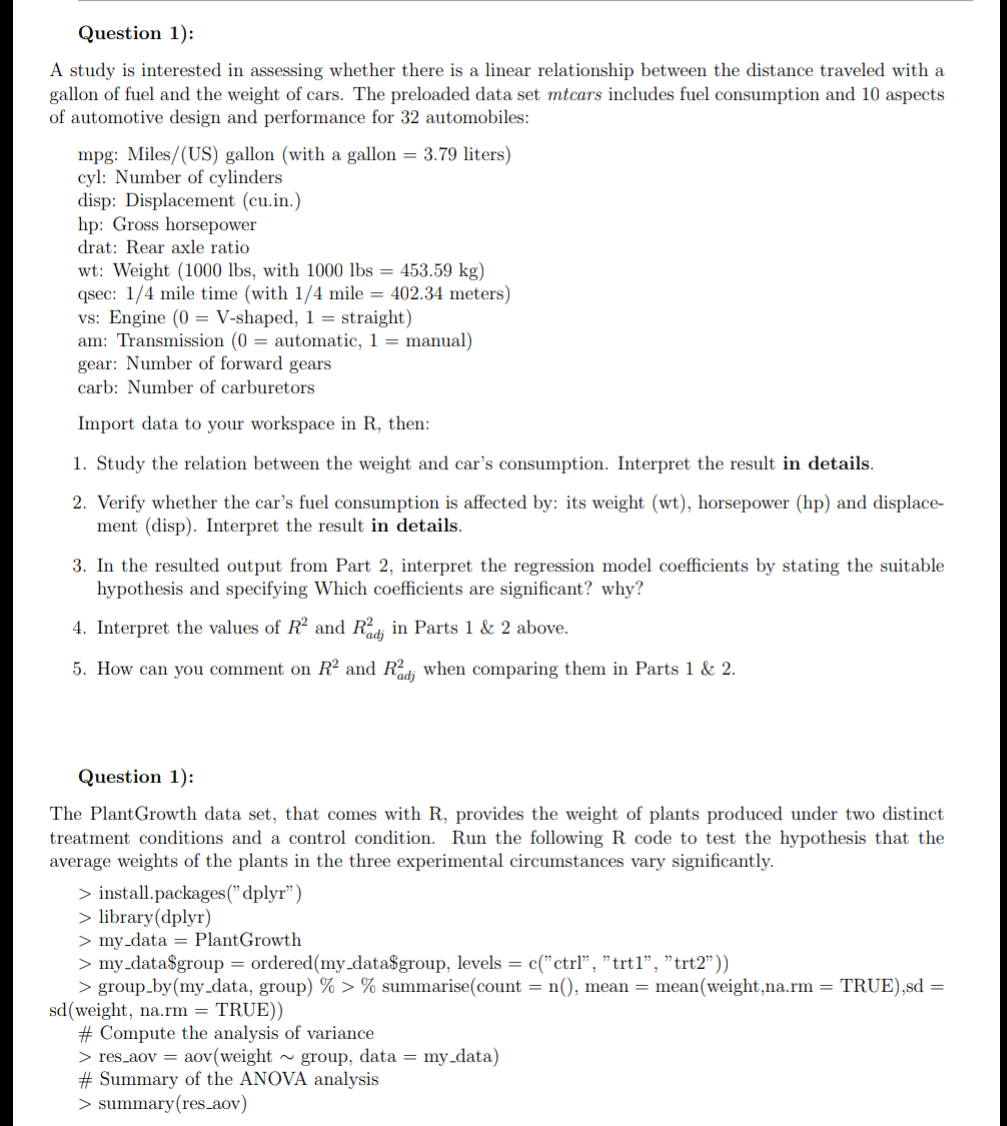
A study is interested in assessing whether there is a linear relationship between the distance traveled with a gallon of fuel and the weight of cars. The preloaded data set mtcars includes fuel consumption and 10 aspects of automotive design and performance for 32 automobiles: mpg: Miles/(US) gallon (with a gallon =3.79 liters) cyl: Number of cylinders disp: Displacement (cu.in.) hp: Gross horsepower drat: Rear axle ratio wt: Weight ( 1000lbs, with 1000lbs=453.59kg ) qsec: 1/4 mile time (with 1/4 mile =402.34 meters) vs: Engine (0=V-shaped, 1= straight ) am: Transmission (0= automatic, 1= manual ) gear: Number of forward gears carb: Number of carburetors Import data to your workspace in R, then: 1. Study the relation between the weight and car's consumption. Interpret the result in details. 2. Verify whether the car's fuel consumption is affected by: its weight (wt), horsepower (hp) and displacement (disp). Interpret the result in details. 3. In the resulted output from Part 2, interpret the regression model coefficients by stating the suitable hypothesis and specifying Which coefficients are significant? why? 4. Interpret the values of R2 and Radj2 in Parts 1&2 above. 5. How can you comment on R2 and Radj2 when comparing them in Parts 1&2. Question 1): The PlantGrowth data set, that comes with R, provides the weight of plants produced under two distinct treatment conditions and a control condition. Run the following R code to test the hypothesis that the average weights of the plants in the three experimental circumstances vary significantly. > install.packages("dplyr") > library (dplyr) > my_data = PlantGrowth > my_data\$group = ordered(my_data\$group, levels =c("ctrl","trt1","trt2")) > group_by(my_data, group) %>% summarise ( count =n(), mean = mean(weight,na.rm = TRUE),sd = sd(weight, na.rm = TRUE) ) \# Compute the analysis of variance > res_aov = aov ( weight group, data = my_data ) \# Summary of the ANOVA analysis > summary(res_aov)
Step by Step Solution
There are 3 Steps involved in it

Get step-by-step solutions from verified subject matter experts