

Question: A survey was conducted to study the relationship between a college student's age and the value of the car they drive. Data were collected from
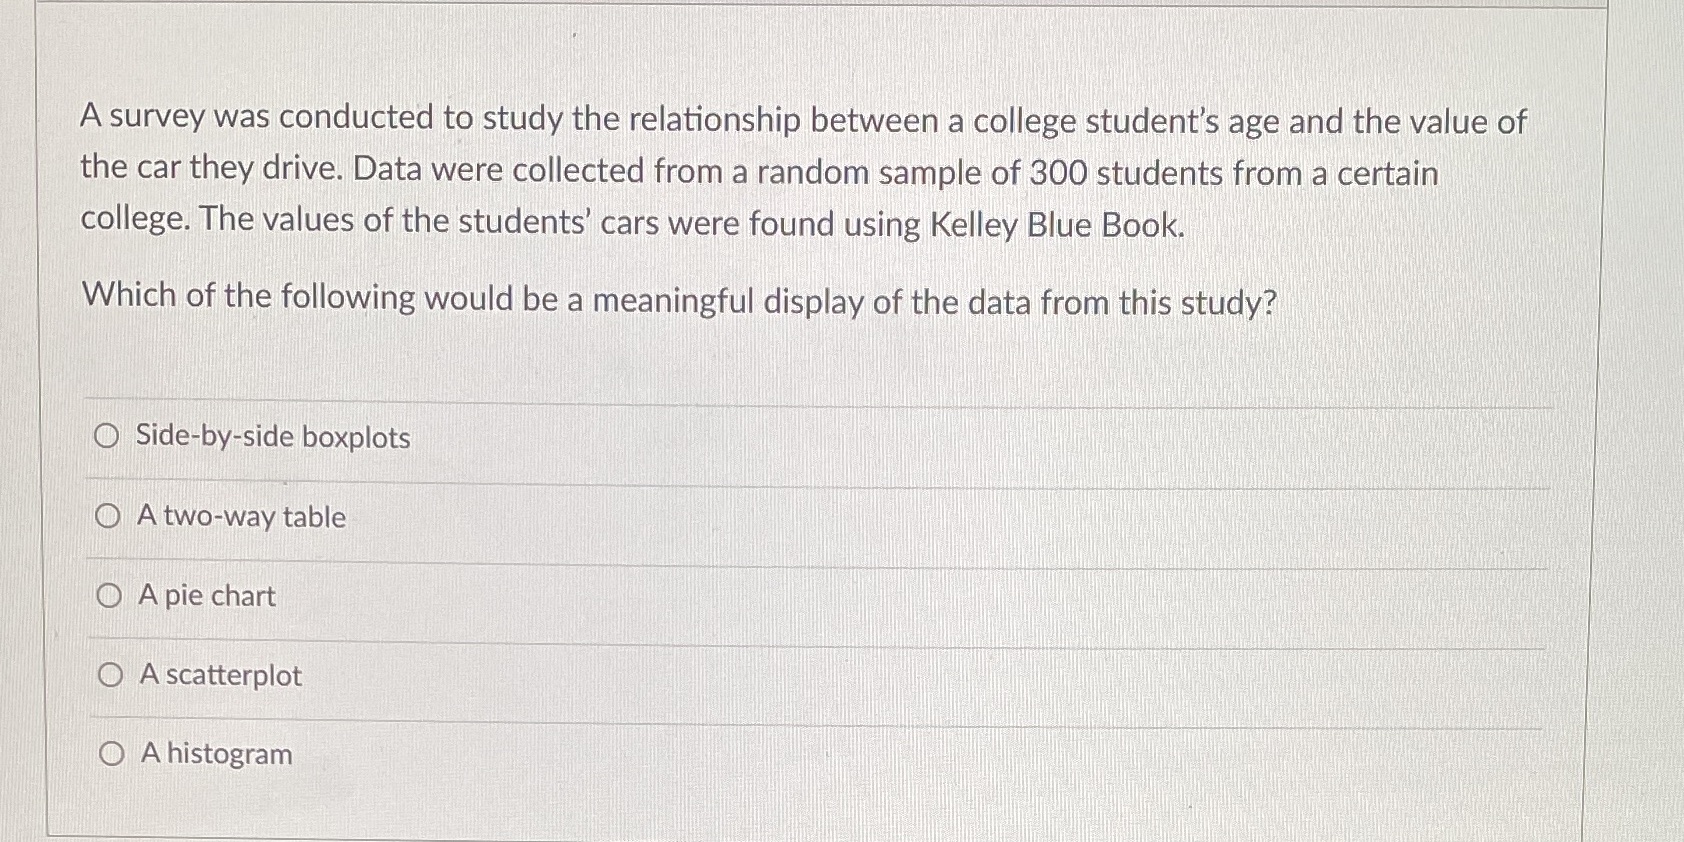
A survey was conducted to study the relationship between a college student's age and the value of the car they drive. Data were collected from a random sample of 300 students from a certain college. The values of the students' cars were found using Kelley Blue Book. Which of the following would be a meaningful display of the data from this study? Side-by-side boxplots A two-way table A pie chart A scatterplot A histogram
Step by Step Solution
There are 3 Steps involved in it
1 Expert Approved Answer
Step: 1 Unlock

Question Has Been Solved by an Expert!
Get step-by-step solutions from verified subject matter experts
Step: 2 Unlock
Step: 3 Unlock