

Question: Question 1 A survey was conducted to study the relationship between a college student's age and the value Select one answer. of the car they

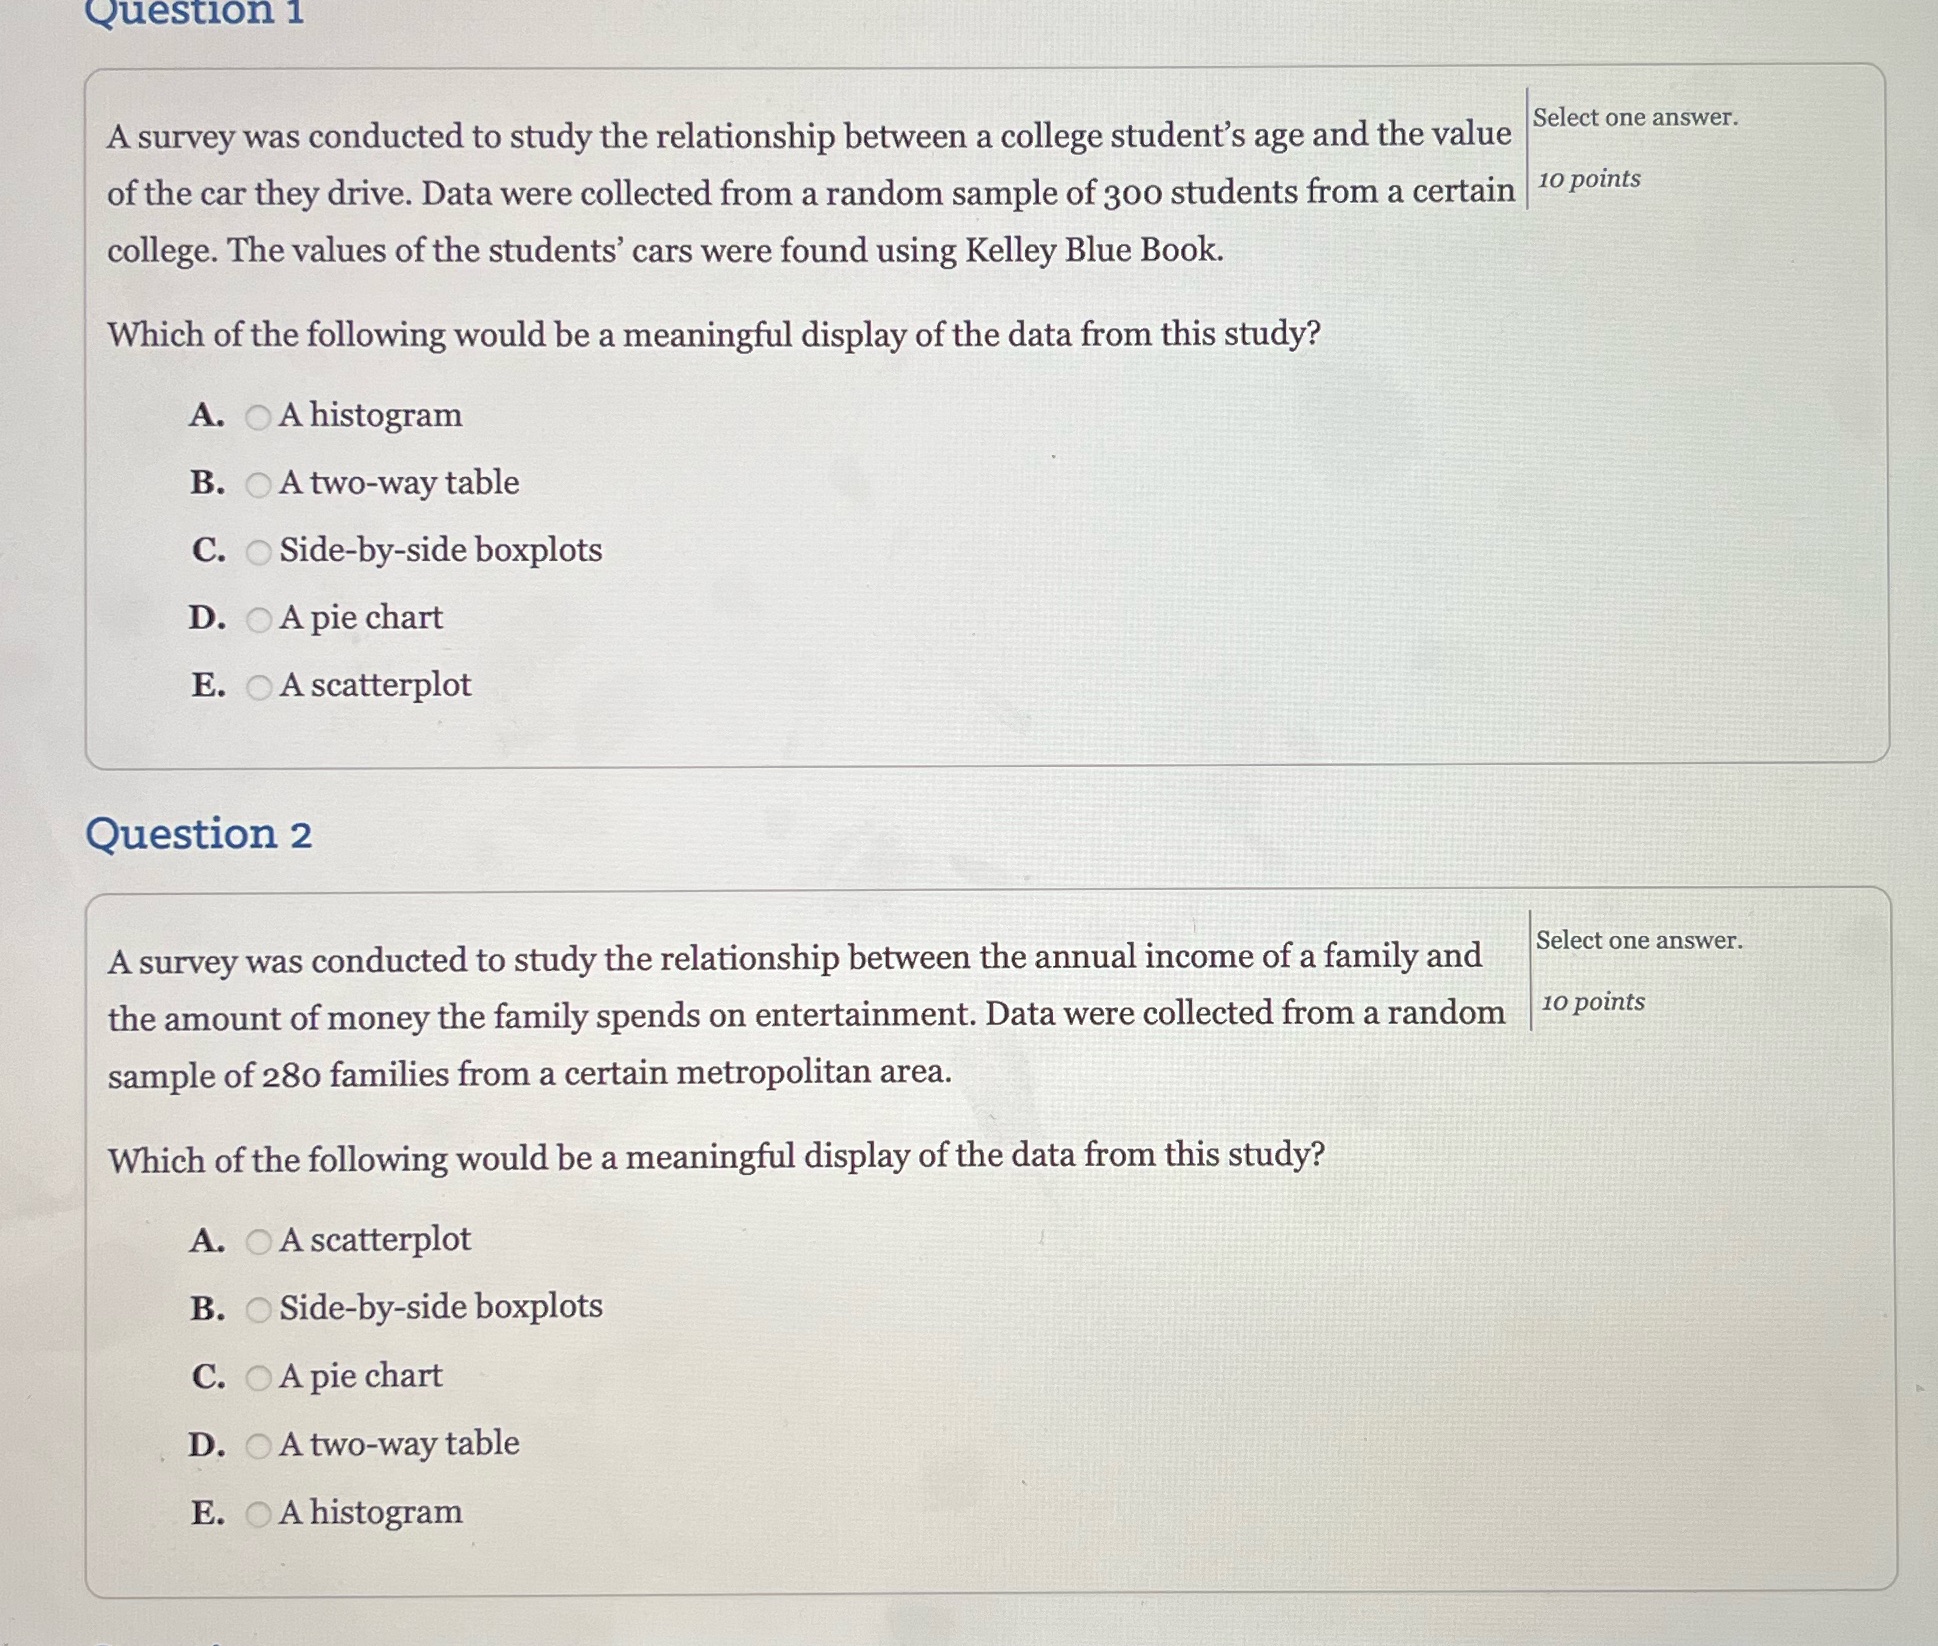
Question 1 A survey was conducted to study the relationship between a college student's age and the value Select one answer. of the car they drive. Data were collected from a random sample of 300 students from a certain 10 points college. The values of the students' cars were found using Kelley Blue Book. Which of the following would be a meaningful display of the data from this study? A. OA histogram B. A two-way table C. Side-by-side boxplots D. OA pie chart E. A scatterplot Question 2 A survey was conducted to study the relationship between the annual income of a family and Select one answer. the amount of money the family spends on entertainment. Data were collected from a random 10 points sample of 280 families from a certain metropolitan area. Which of the following would be a meaningful display of the data from this study? A. OA scatterplot B. OSide-by-side boxplots C. OA pie chart D. OA two-way table E. OA histogram
Step by Step Solution
There are 3 Steps involved in it

Get step-by-step solutions from verified subject matter experts