

Question: a) Table 1 below shows mean excess returns (returns in excess of the risk-free rate), standard devi- ations, Sharpe ratios, and CAPM alphas for
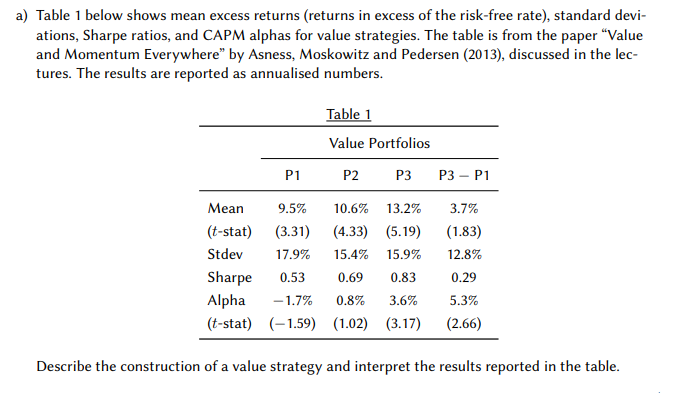
a) Table 1 below shows mean excess returns (returns in excess of the risk-free rate), standard devi- ations, Sharpe ratios, and CAPM alphas for value strategies. The table is from the paper "Value and Momentum Everywhere" by Asness, Moskowitz and Pedersen (2013), discussed in the lec- tures. The results are reported as annualised numbers. P1 Table 1 Value Portfolios P2 P3 Mean 9.5% 10.6% 13.2% (t-stat) (3.31) (4.33) (5.19) Stdev 17.9% 15.4% 15.9% Sharpe 0.53 0.69 0.83 Alpha -1.7% 0.8% 3.6% (t-stat) (-1.59) (1.02) (3.17) P3 - P1 3.7% (1.83) 12.8% 0.29 5.3% (2.66) Describe the construction of a value strategy and interpret the results reported in the table.
Step by Step Solution
There are 3 Steps involved in it
A value strategy is an investment approach that focuses on identifying undervalued stocks or assets based on their fundamental characteristics such as low pricetoearnings PE ratios low pricetobook PB ... View full answer

Get step-by-step solutions from verified subject matter experts