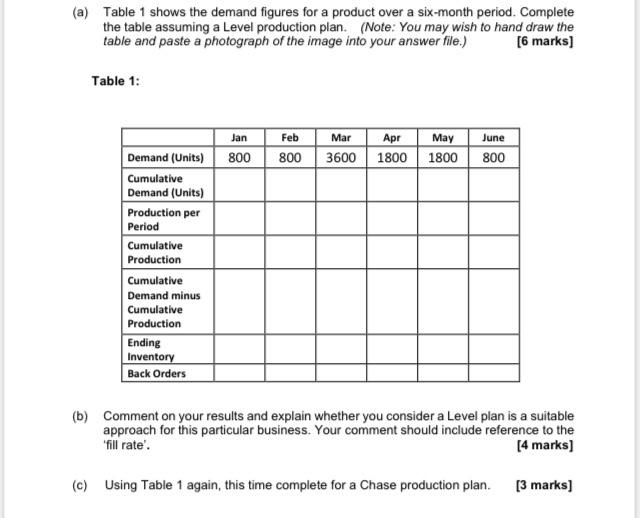
Question: (a) Table 1 shows the demand figures for a product over a six-month period. Complete the table assuming a Level production plan. (Note: You may

(a) Table 1 shows the demand figures for a
(a) Table 1 shows the demand figures for a product over a six-month period. Complete the table assuming a Level production plan. (Note: You may wish to hand draw the table and paste a photograph of the image into your answer file.) [6 marks) Table 1: Jan 800 Feb Mar Apr May June 800 3600 1800 1800 800 Demand (Units) Cumulative Demand (Units) Production per Period Cumulative Production Cumulative Demand minus Cumulative Production Ending Inventory Back Orders (b) Comment on your results and explain whether you consider a Level plan is a suitable approach for this particular business. Your comment should include reference to the 'fill rate'. (4 marks] (c) Using Table 1 again, this time complete for a Chase production plan. [3 marks] (d) Explain whether a Level or Chase plan is more suitable for the demand pattern experienced by this business. You should support your answer with numerical data derived from Table 2. In comparing the costs, state any assumptions made. Assume a starting workforce of 8 and that fractional workers are permissible. [12 marks] Table 2: 200 Units produced per worker per period Hiring cost per worker Firing cost per worker Inventory Holding Cost per unit per period Shortage Cost per unit per period 400 600 5 7.50

Step by Step Solution

There are 3 Steps involved in it

1 Expert Approved Answer
Step: 1 Unlock blur-text-image
Question Has Been Solved by an Expert!

Get step-by-step solutions from verified subject matter experts

Step: 2 Unlock
Step: 3 Unlock

Students Have Also Explored These Related General Management Questions!