

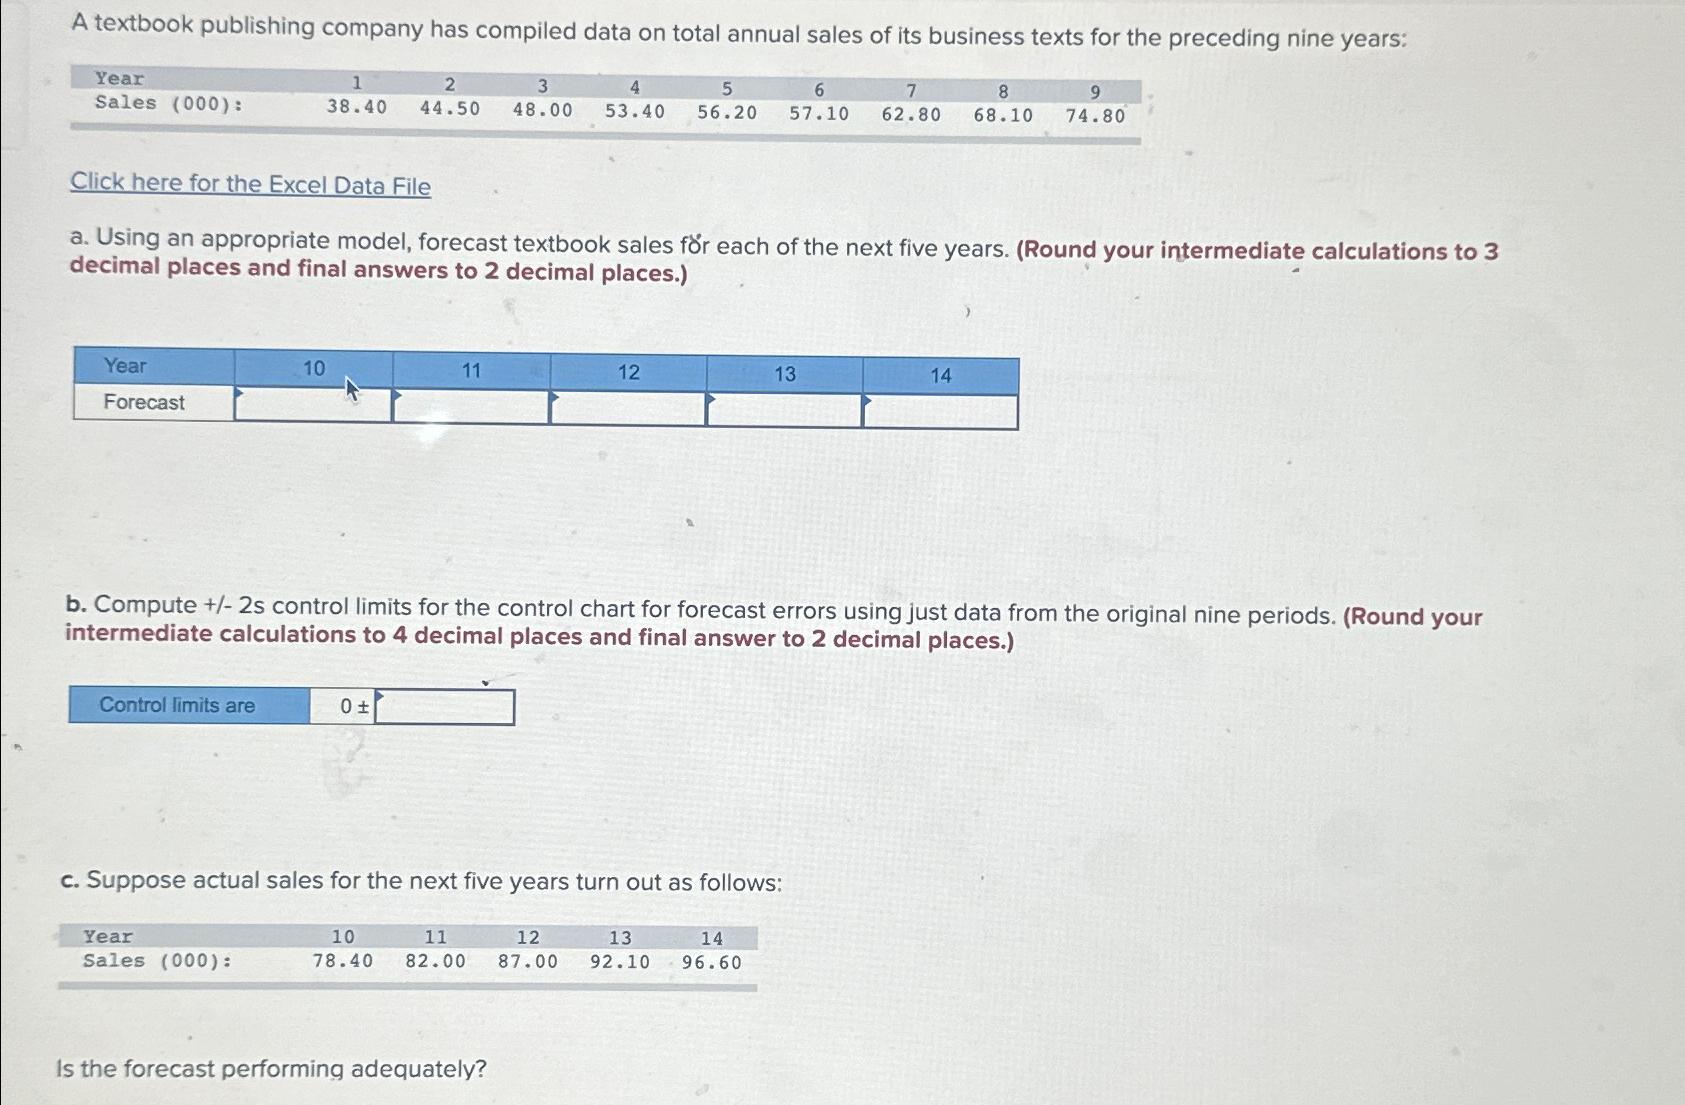
Question: A textbook publishing company has compiled data on total annual sales of its business texts for the preceding nine years: table [ [ Year
A textbook publishing company has compiled data on total annual sales of its business texts for the preceding nine years:
tableYearSales :
Click here for the Excel Data File
a Using an appropriate model, forecast textbook sales fr each of the next five years. Round your intermediate calculations to decimal places and final answers to decimal places.
tableYearForecast
b Compute control limits for the control chart for forecast errors using just data from the original nine periods. Round your intermediate calculations to decimal places and final answer to decimal places.
Control limits are
c Suppose actual sales for the next five years turn out as follows:
tableYearSales :
Is the forecast performing adequately?
Step by Step Solution
There are 3 Steps involved in it
1 Expert Approved Answer
Step: 1 Unlock

Question Has Been Solved by an Expert!
Get step-by-step solutions from verified subject matter experts
Step: 2 Unlock
Step: 3 Unlock