

Question: (a) The BETA(a, b) distribution is appropriate for modeling data that are bounded between 0 and 1, and so it is a sensible distribution
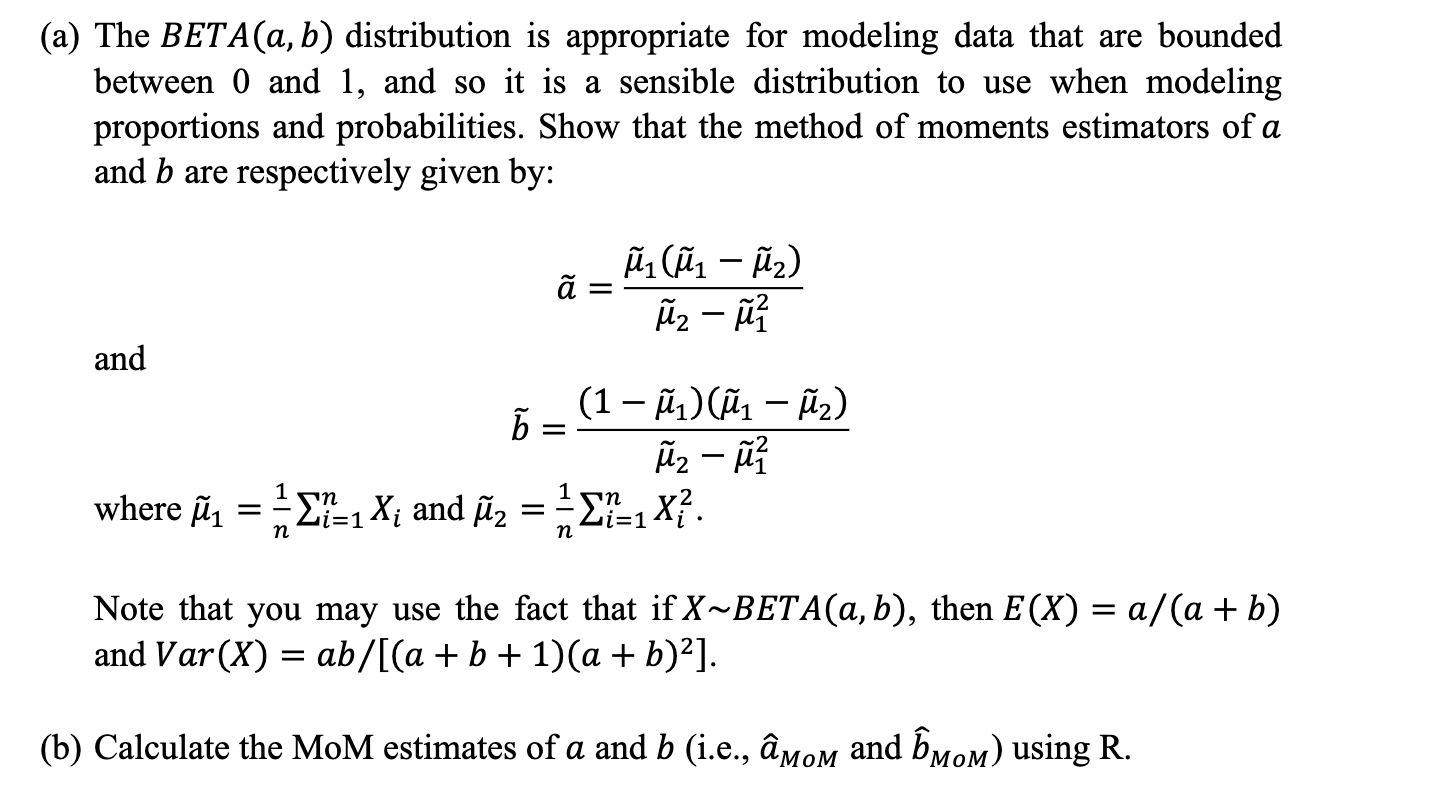
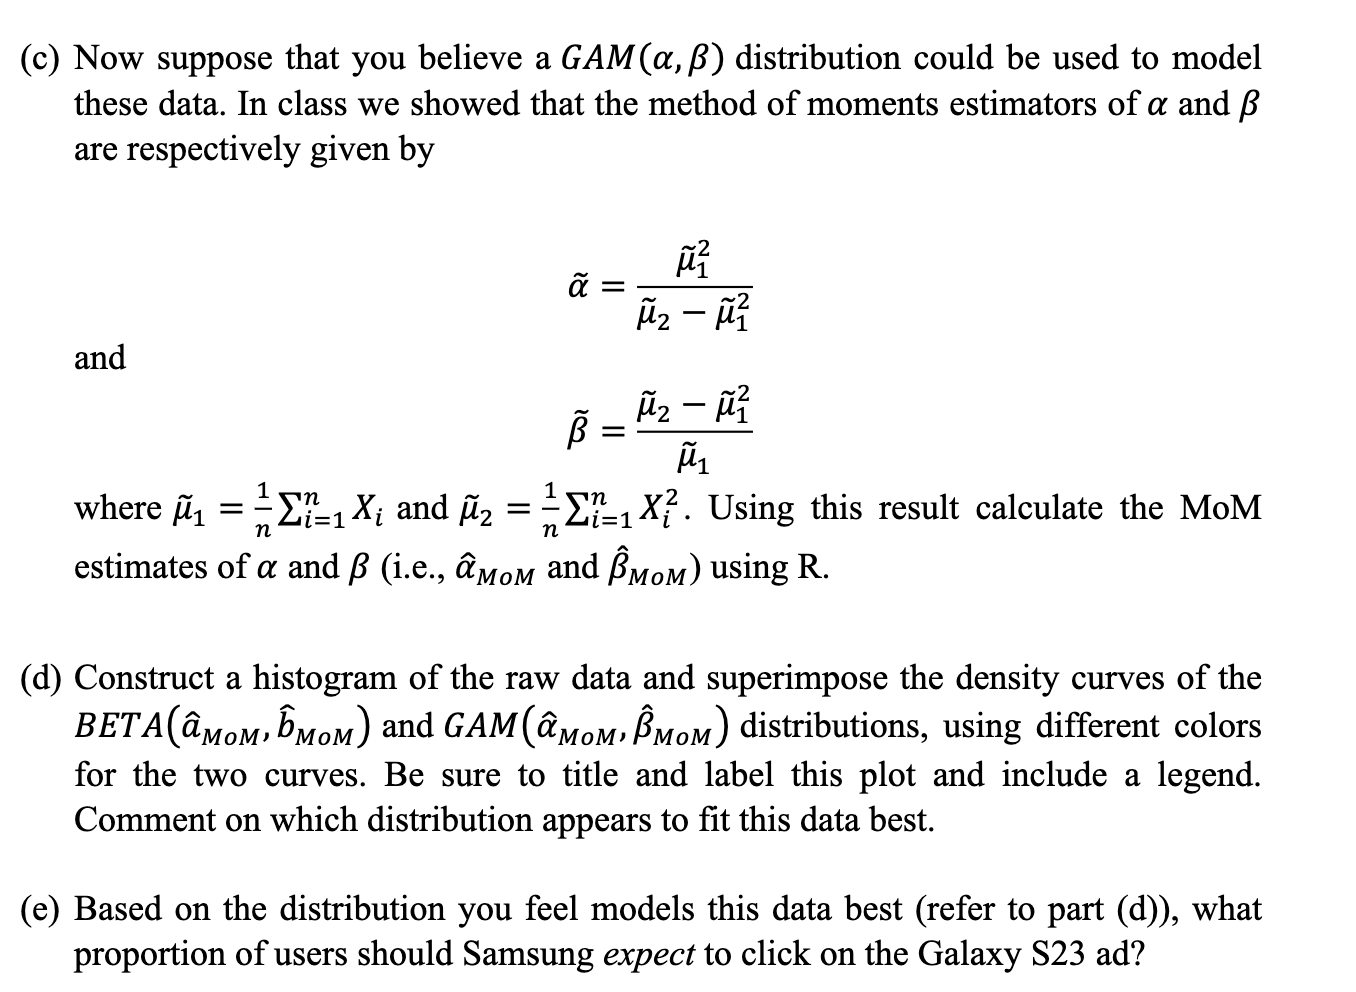
(a) The BETA(a, b) distribution is appropriate for modeling data that are bounded between 0 and 1, and so it is a sensible distribution to use when modeling proportions and probabilities. Show that the method of moments estimators of a and b are respectively given by: ( - ) and = - (1 )( ) = - 1 'n i=1 1X and == x. where = Zi=1 n n Note that you may use the fact that if X~BETA(a,b), then E(X) = a/(a + b) and Var (X) = ab/[(a+b+1)(a + b)]. (b) Calculate the MoM estimates of a and b (i.e., o and o) using R. (c) Now suppose that you believe a GAM(a, ) distribution could be used to model these data. In class we showed that the method of moments estimators of a and B are respectively given by and = - - 1 n Zi=1 10 1 n n where = and = -X. Using this result calculate the MoM n estimates of a and (i.e., o and o) using R. (d) Construct a histogram of the raw data and superimpose the density curves of the BETA (@MOM, OM) and GAM (@MOM, BMOM) distributions, using different colors for the two curves. Be sure to title and label this plot and include a legend. Comment on which distribution appears to fit this data best. (e) Based on the distribution you feel models this data best (refer to part (d)), what proportion of users should Samsung expect to click on the Galaxy S23 ad?
Step by Step Solution
There are 3 Steps involved in it

Get step-by-step solutions from verified subject matter experts