Question: EXPLORATIO Is Yawning Contagious? STEP 1: Ask a research question. Is yawning contagious? Conventional wisdom says yes When we see someone else yawn, we're prone
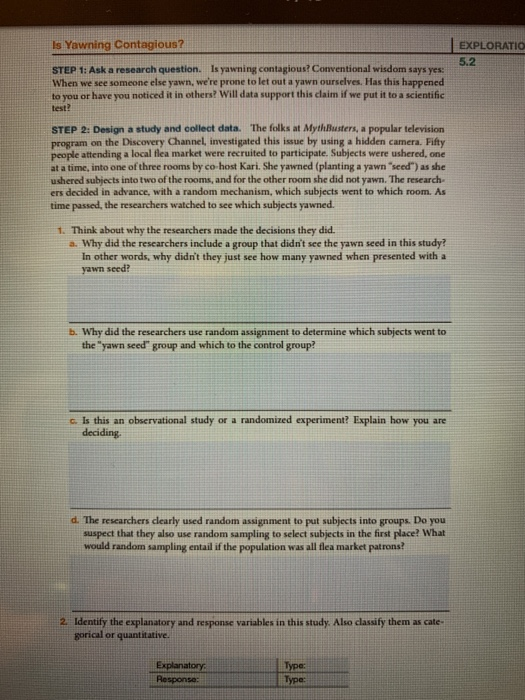
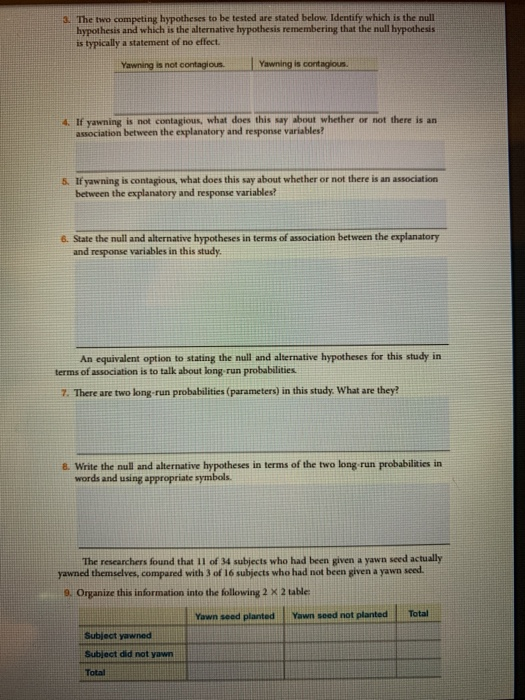
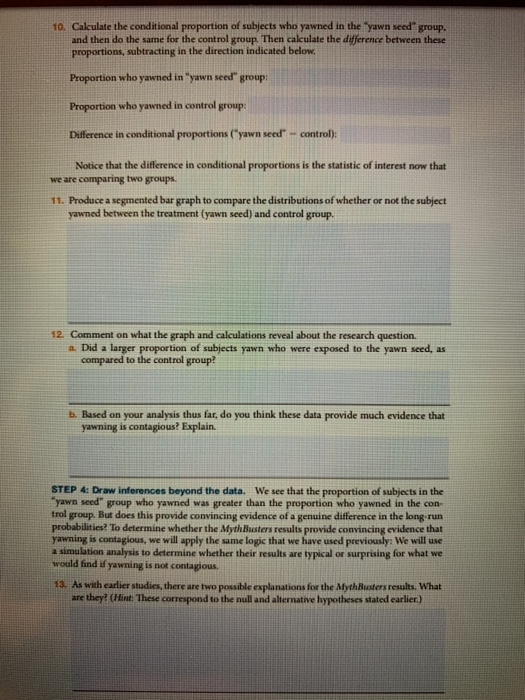
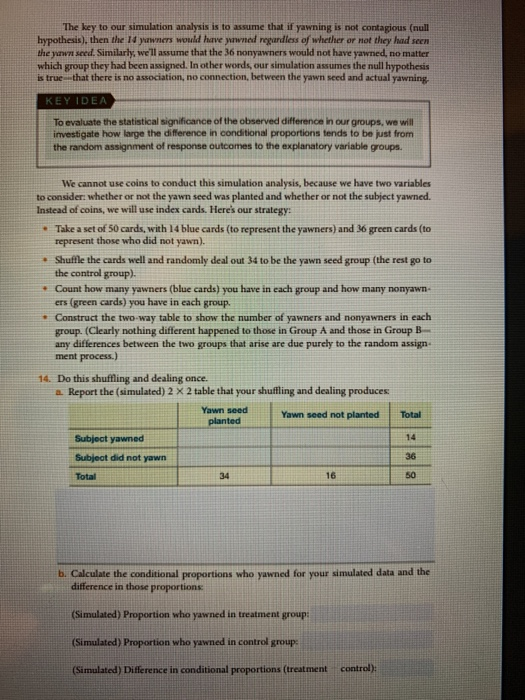
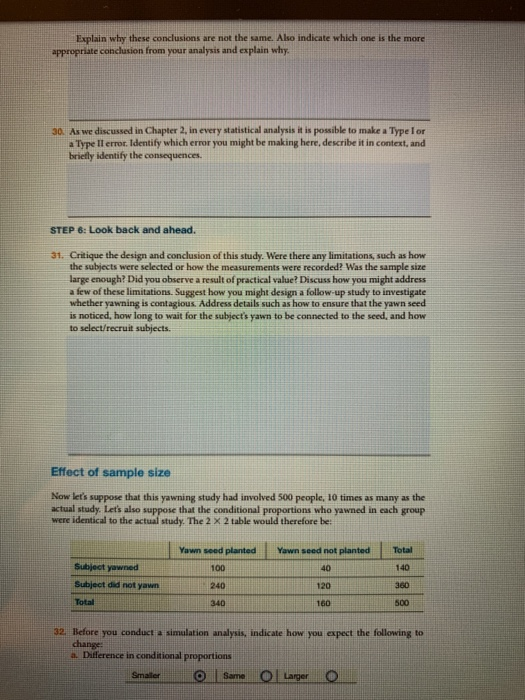
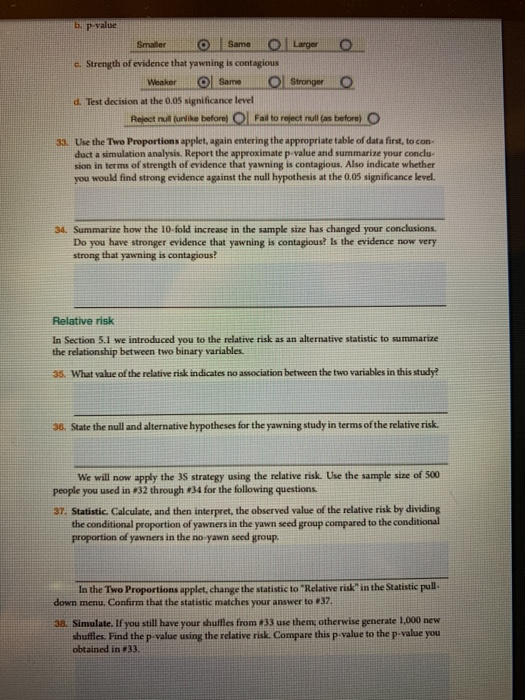
EXPLORATIO Is Yawning Contagious? STEP 1: Ask a research question. Is yawning contagious? Conventional wisdom says yes When we see someone else yawn, we're prone to let out a yawn ourselves. Has this happened to you or have you noticed it in others? Will data support this claim if we put it to a scientific test? STEP 2: Design a study and collect data. The folks at MythBusters, a popular television program on the Discovery Channel, investigated this issue by using a hidden camera. Fifty people attending a local flea market were recruited to participate. Subjects were ushered, one at a time, into one of three rooms by co-host Kari. She yawned (planting a yawn "seed") as she ushered subjects into two of the rooms, and for the other room she did not yawn. The research ers decided in advance, with a random mechanism, which subjects went to which room. As time passed, the researchers watched to see which subjects yawned. 1. Think about why the researchers made the decisions they did. a. Why did the researchers include a group that didn't see the yawn seed in this study? In other words, why didn't they just see how many yawned when presented with a yawn seed? b. Why did the researchers use random assignment to determine which subjects went to the "yawn seed" group and which to the control group? c. Is this an observational study or a randomized experiment? Explain how you are deciding. d. The researchers clearly used random assignment to put subjects into groups. Do you suspect that they also use random sampling to select subjects in the first place? What would random sampling entail if the population was all flea market patrons? 2. Identify the explanatory and response variables in this study. Also classify them as cate gorical or quantitative. Explanatory Response Type 3. The two competing hypotheses to be tested are stated below. Identify which is the null hypothesis and which is the alternative hypothesis remembering that the null hypothesis is typically a statement of no effect. Yawning is not contagious. Yawning is contagious 4. If yawning is not contagious, what does this say about whether or not there is an association between the explanatory and response variables? If yawning is contagious, what does this say about whether or not there is an association between the explanatory and response variables! 6. State the null and alternative hypotheses in terms of association between the explanatory and response variables in this study. An equivalent option to stating the null and alternative hypotheses for this study in terms of association is to talk about long run probabilities 7. There are two long-run probabilities (parameters) in this study, What are they? & Write the null and alternative hypotheses in terms of the two long run probabilities in words and using appropriate symbols The researchers found that 11 of 34 subjects who had been given a yawn seed actually yawned themselves, compared with 3 of 16 subjects who had not been given a yawn seed 9. Organize this information into the following 2 x 2 table: Yawn seed planted Yawn seed not planted Total 10. Calculate the conditional proportion of subjects who yawned in the yawn seed" group and then do the same for the control group. Then cakulate the difference between these proportions, subtracting in the direction indicated below. Proportion who yawned in "yawn seed" group: Proportion who yawned in control group: Difference in conditional proportions ("yawn seed-control): Notice that the difference in conditional proportions is the statistic of interest now that we are comparing two groups. 11. Produce a segmented bar graph to compare the distributions of whether or not the subject yawned between the treatment (yawn seed) and control group. 12. Comment on what the graph and calculations reveal about the research question a. Did a larger proportion of subjects yawn who were exposed to the yawn seed, as compared to the control group? b. Based on your analysis thus far, do you think these data provide much evidence that yawning is contagious? Explain. STEP 4: Draw inferences beyond the data. We see that the proportion of subjects in the "yawa seed group who yawned was greater than the proportion who yawned in the con trol group. But does this provide convincing evidence of a genuine difference in the long run probabilities? To determine whether the MythBusters results provide convincing evidence that yawning is contagious, we will apply the same logic that we have used previously: We will use a simulation analysis to determine whether their results are typical or surprising for what we would find if yawning is not contagious. 13. As with earlier studies, there are two possible explanations for the MythBusters results. What are they? (Hint: These correspond to the null and alternative hypotheses stated earlier.) The key to our simulation analysis is to assume that if yawning is not contagious (null hypothesis), then the dywners would have ynned regardless of whether or not they had seen the yon seed. Similarly, we'll assume that the 36 nonyawners would not have yawned, no matter which group they had been assigned. In other words, our simulation assumes the null hypothesis is true that there is no association, no connection between the yawn seed and actual yawning KEY IDEA To evaluate the statistical significance of the observed difference in our groups, we will investigate how large the difference in conditional proportions tends to be just from the random assignment of response outcomes to the explanatory variable groups. We cannot use coins to conduct this simulation analysis, because we have two variables to consider: whether or not the yawn seed was planted and whether or not the subject yawned. Instead of coins, we will use index cards. Here's our strategy: Take a set of 50 cards, with 14 blue cards (to represent the yawners) and 36 green cards (to represent those who did not yawn). Shuffle the cards well and randomly deal out 34 to be the yawn seed group (the rest go to the control group). Count how many yawners (blue cards) you have in each group and how many nonyawn ers (green cards) you have in each group. Construct the two-way table to show the number of yawners and nonyawners in each group. (Clearly nothing different happened to those in Group A and those in Group B any differences between the two groups that arise are due purely to the random assign ment process.) 14. Do this shuffling and dealing once. Report the simulated) 2 x 2 table that your shuffling and dealing produces Yawn seed Yawn seed not planted planted Subject yawned Subject did not yawn Total b. Calculate the conditional proportions who yawned for your simulated data and the difference in those proportions (Simulated) Proportion who yawned in treatment group: (Simulated) Proportion who yawned in control group: (Simulated) Difference in conditional proportions (treatment control): 5 TU a. Is your simulated statistic (difference in conditional proportions) at least as large as the observed value of the statistic from the MythBusters study? We need to perform a large number of repetitions (say 1,000 or more) in order to assess whether the MythBusters result is typical or surprising when yawning is not contagious. To do this we will use an applet specifically designed for this purposes the Twe Proportions applet. 15. Open this applet and verify the two-way table, segmented bar graph, and observed differ ence in simulated proportions you found above. Check the Show Shuffle Options box. Notice how the cards have been set up: 14 blue cards, with 11 in the yawners group. Press Shuffle to shuffle the cards and redistribute them to the two groups. How many yawners ended up in the seeded group? What is the corresponding difference in the conditional proportions for the shuffled data? b. Press the Shuffle button four more times. Record the difference in proportions each time. Was it always the same number? Notice that each of these values has been added to the dotplot on the right (Technical details In this case, it's equivalent to looking at the number of blue cards in the yuwn group or the difference in conditional proportions as the statistic of interest.) 16. Uke this applet to conduct 1,000 repetitions of this simulation: Change the Number of Shuffles from 1 to 995 (for a total of 1,000) and press Shuffle. The applet produces a dotplot showing the null distribution for the difference in proportions of yawners between the two groups. Map this simulation to the research study Null hypothesis One repetition Statist 17. Look more closely at the simulated null distribution for the difference in proportions of yawners between the two groups. Is this null distribution centered around 0? Explain why this makes sense. (Hint: Think about the choice of statistic and about the null hypothesis, which was the basis of the simulation analysis.) Drott 6/10 b. Is the observed value of the Natistic from the MythBuster study (0.16) out in the tail of this null distribution or not so much in other words, does the observed result appear to be typical or surprising when the null hypothesis (that yawning is not conta gious) is truet As you know, you can assess the strength of evidence against the null hypothesis by calculating a p value. To calculate a p-value from this null distribution, you will count the number of repetitions that produced a simulated difference in proportions equal (choose more or less) 18. Enter the observed difference in the sample proportions in the Count Samples box and choose the direction from the pull-down menu and press Count Check whether the shaded region of the dotplot corresponds with your answer to 17. Then report this approximate p-value Interpret this p value by filling in the following blanks Under the assumption that if we repeatedly many, many times, the probability we would obtain a difference in conditional proportions as or more extreme than is about . Evaluate this p value: Using guidelines for assessing the strength of evidence from p-values, would you conclude that the MythBusters result provides much evidence that yawning is contagious? We have a small confession to make. We fudged the data from this study a bit. The actual data showed that 10 of the 34 subjects in the yawn seed group yawned themselves, and 4 of the 16 in the control group yawned 21. Recalculate the conditional proportions who yawned for these data Proportion who yawned in the "yawn seed" group Proportion who yawned in the control group Difference in conditional proportions (yawn seed-control) 22. How has your observed statistic changed from the originally presented data? Sealer Same O Larger O 21. Before you carry out the interne using this post confession obr a tit, let make some predictions How do you expect the p value and strength of evidence to change from your earlier analysis Cinde your choices below and then explain why you circled what you did p-value Sealer 0 Same O larger Strength of evidence 7/10 O Same Stronger o 24. Conduct a simation analysis to check your answer predictions from the previous question. To do this, enter the new values into the four bones of the table and press Use Table. Then ask for 1.000 repetitions in your simulation analysis. Enter the new observed value of the statistic and then press the Count button. Report the approximate p-value and summarize your conclusion in terms of strength of evidence that yawning is contagious Estimation Because the MythBusters data did not reveal a significant difference between the groups, it's less important than usual to estimate the parameter value. But we can still use the simulation results to estimate 95% confidence interval for the relevant parameter. Keep in mind that the relevant parameter is now the difference in the long run probabilities between the yawn seed treatment and the ne yawn seed treatment. 25. The parameter of interest in this yawning study can be expressed in symbol Describe what this parameter means in words 1. Report again) the observed value of the statistic from the MythBusters actual data (Hit Recall that the statistic is the difference in conditional proportions between the two groups) The observed value of this statistic is your best estimate of the unknown parameter value. But we should produce an interval estimate centered on this observed value. To do that we again need to consider the chance variability in the statistic c. From the simulation analysis that you conducted on the postconfession Myth busters data, what was the standard deviation of the null distribution? To enter special characters and formatting, use "Ctrl+Ein Windows and Cmd + Ein Mac 8/10 d. Determine endpoints of a 95%25D confidence interval for the difference by taking the observed value of the statistic + 2 standard deviations e. Does this confidence interval include only positive values, only negative values, or nero as well as positive and negative values? Explain the importance of your answer to part(e) in terms of whether the data provide evidence that subjects who experience a yawn seed are more likely to yawn than those who do not experience a yawn seed? STEP 5: Formulate conclusions. 26. The MythBusters hosts concluded from their study that there is little doubt, yawning seems to be contagious. Based on your simulation analysis of their data, considering the issue of statistical significance, do you agree with this conclusion? Explain your answer as if to the hosts, without using statistical jargon. Be sure to include in your answer an explanation for why you conducted the simulation analysis and what the analysis revealed about the research question. 27. If you had decided that the two groups differed significantly, would you have been just fied in drawing a cause and effect conclusion between the yawn seed and an increased probability of yawning? Explain, based on how the study was conducted 2. Based on how the sample was selected, to what larger population would you feel comfort able generalizing the results of this study? Justify your answer 20. Think about the difference between these two possible conclusions L The data strongly suggest that yawning is not contagious The data do not provide convincing evidence to suggest that yawning is contagious Explain why these conclusions are not the same. Also indicate which one is the more appropriate conclusion from your analysis and explain why 30. As we discussed in Chapter 2, in every statistical analysis it is possible to make a type lor Type Il error. Identify which error you might be making here, describe it in context, and briefly identify the consequences. STEP 6: Look back and ahead. 31. Critique the design and conclusion of this study, Were there any limitations, such as how the subjects were selected or how the measurements were recorded? Was the sample size large enough? Did you observe a result of practical value? Discuss how you might address a few of these limitations Surest how you might design a follow-up study to investigate whether yawning is contagious. Address details such as how to ensure that the yawn seed is noticed, how long to wait for the subject's yawn to be connected to the seed, and how to select/recruit subjects. Effect of sample size Now let's suppose that this yawning study had involved 500 people, 10 times as many as the actual study, Let's also suppose that the conditional proportions who yawned in each group were identical to the actual study. The 2 x 2 table would therefore be: Yawn seed planted Yawn seed not planted Total Subject owned Subject did not yaw 32. Before you conduct a simulation analysis, indicate how you expect the following to change a Difference in conditional proportions Smaller O Same O Larger o b. p value Smaller Same O Larger O c. Strength of evidence that yawning is contagious Weaker O Same Ol Stronger O d. Test decision at the 0.05 significance level Reject rull forlike before) Ol Fal to reject rullas before) 33. Use the Two Proportions applet, again entering the appropriate table of data first to con duct a simulation analysis. Report the approximate p value and summarize your conclu sion in terms of strength of evidence that yawning is contagious. Also indicate whether you would find strong evidence against the null hypothesis at the 0.05 significance level Summarize how the 10-fold increase in the sample size has changed your conclusions. Do you have stronger evidence that yawning is contagious? Is the evidence now very strong that yawning is contagious? Relative risk In Section 5.1 we introduced you to the relative risk as an alternative statistic to summarize the relationship between two binary variables 35. What value of the relative risk indicates no association between the two variables in this study? 36. State the null and alternative hypotheses for the yawning study in terms of the relative risk. We will now apply the 5 strategy using the relative risk. Use the sample sire of 500 people you used in 32 through 234 for the following questions 37. Statistic. Calculate, and then interpret the observed value of the relative risk by dividing the conditional proportion of yawners in the yawn seed group compared to the conditional proportion of yawners in the no yawn seed group In the Two Proportions applet, change the statistic to Relative risk in the Statistic pull down menu. Confirm that the statistic matches your answer to #37 38. Simulate. If you still have your shuffles from 33 use them, otherwise generate 1,000 new shuffles. Find the p-value using the relative risk. Compare this p-value to the p-value you obtained in.33. EXPLORATIO Is Yawning Contagious? STEP 1: Ask a research question. Is yawning contagious? Conventional wisdom says yes When we see someone else yawn, we're prone to let out a yawn ourselves. Has this happened to you or have you noticed it in others? Will data support this claim if we put it to a scientific test? STEP 2: Design a study and collect data. The folks at MythBusters, a popular television program on the Discovery Channel, investigated this issue by using a hidden camera. Fifty people attending a local flea market were recruited to participate. Subjects were ushered, one at a time, into one of three rooms by co-host Kari. She yawned (planting a yawn "seed") as she ushered subjects into two of the rooms, and for the other room she did not yawn. The research ers decided in advance, with a random mechanism, which subjects went to which room. As time passed, the researchers watched to see which subjects yawned. 1. Think about why the researchers made the decisions they did. a. Why did the researchers include a group that didn't see the yawn seed in this study? In other words, why didn't they just see how many yawned when presented with a yawn seed? b. Why did the researchers use random assignment to determine which subjects went to the "yawn seed" group and which to the control group? c. Is this an observational study or a randomized experiment? Explain how you are deciding. d. The researchers clearly used random assignment to put subjects into groups. Do you suspect that they also use random sampling to select subjects in the first place? What would random sampling entail if the population was all flea market patrons? 2. Identify the explanatory and response variables in this study. Also classify them as cate gorical or quantitative. Explanatory Response Type 3. The two competing hypotheses to be tested are stated below. Identify which is the null hypothesis and which is the alternative hypothesis remembering that the null hypothesis is typically a statement of no effect. Yawning is not contagious. Yawning is contagious 4. If yawning is not contagious, what does this say about whether or not there is an association between the explanatory and response variables? If yawning is contagious, what does this say about whether or not there is an association between the explanatory and response variables! 6. State the null and alternative hypotheses in terms of association between the explanatory and response variables in this study. An equivalent option to stating the null and alternative hypotheses for this study in terms of association is to talk about long run probabilities 7. There are two long-run probabilities (parameters) in this study, What are they? & Write the null and alternative hypotheses in terms of the two long run probabilities in words and using appropriate symbols The researchers found that 11 of 34 subjects who had been given a yawn seed actually yawned themselves, compared with 3 of 16 subjects who had not been given a yawn seed 9. Organize this information into the following 2 x 2 table: Yawn seed planted Yawn seed not planted Total 10. Calculate the conditional proportion of subjects who yawned in the yawn seed" group and then do the same for the control group. Then cakulate the difference between these proportions, subtracting in the direction indicated below. Proportion who yawned in "yawn seed" group: Proportion who yawned in control group: Difference in conditional proportions ("yawn seed-control): Notice that the difference in conditional proportions is the statistic of interest now that we are comparing two groups. 11. Produce a segmented bar graph to compare the distributions of whether or not the subject yawned between the treatment (yawn seed) and control group. 12. Comment on what the graph and calculations reveal about the research question a. Did a larger proportion of subjects yawn who were exposed to the yawn seed, as compared to the control group? b. Based on your analysis thus far, do you think these data provide much evidence that yawning is contagious? Explain. STEP 4: Draw inferences beyond the data. We see that the proportion of subjects in the "yawa seed group who yawned was greater than the proportion who yawned in the con trol group. But does this provide convincing evidence of a genuine difference in the long run probabilities? To determine whether the MythBusters results provide convincing evidence that yawning is contagious, we will apply the same logic that we have used previously: We will use a simulation analysis to determine whether their results are typical or surprising for what we would find if yawning is not contagious. 13. As with earlier studies, there are two possible explanations for the MythBusters results. What are they? (Hint: These correspond to the null and alternative hypotheses stated earlier.) The key to our simulation analysis is to assume that if yawning is not contagious (null hypothesis), then the dywners would have ynned regardless of whether or not they had seen the yon seed. Similarly, we'll assume that the 36 nonyawners would not have yawned, no matter which group they had been assigned. In other words, our simulation assumes the null hypothesis is true that there is no association, no connection between the yawn seed and actual yawning KEY IDEA To evaluate the statistical significance of the observed difference in our groups, we will investigate how large the difference in conditional proportions tends to be just from the random assignment of response outcomes to the explanatory variable groups. We cannot use coins to conduct this simulation analysis, because we have two variables to consider: whether or not the yawn seed was planted and whether or not the subject yawned. Instead of coins, we will use index cards. Here's our strategy: Take a set of 50 cards, with 14 blue cards (to represent the yawners) and 36 green cards (to represent those who did not yawn). Shuffle the cards well and randomly deal out 34 to be the yawn seed group (the rest go to the control group). Count how many yawners (blue cards) you have in each group and how many nonyawn ers (green cards) you have in each group. Construct the two-way table to show the number of yawners and nonyawners in each group. (Clearly nothing different happened to those in Group A and those in Group B any differences between the two groups that arise are due purely to the random assign ment process.) 14. Do this shuffling and dealing once. Report the simulated) 2 x 2 table that your shuffling and dealing produces Yawn seed Yawn seed not planted planted Subject yawned Subject did not yawn Total b. Calculate the conditional proportions who yawned for your simulated data and the difference in those proportions (Simulated) Proportion who yawned in treatment group: (Simulated) Proportion who yawned in control group: (Simulated) Difference in conditional proportions (treatment control): 5 TU a. Is your simulated statistic (difference in conditional proportions) at least as large as the observed value of the statistic from the MythBusters study? We need to perform a large number of repetitions (say 1,000 or more) in order to assess whether the MythBusters result is typical or surprising when yawning is not contagious. To do this we will use an applet specifically designed for this purposes the Twe Proportions applet. 15. Open this applet and verify the two-way table, segmented bar graph, and observed differ ence in simulated proportions you found above. Check the Show Shuffle Options box. Notice how the cards have been set up: 14 blue cards, with 11 in the yawners group. Press Shuffle to shuffle the cards and redistribute them to the two groups. How many yawners ended up in the seeded group? What is the corresponding difference in the conditional proportions for the shuffled data? b. Press the Shuffle button four more times. Record the difference in proportions each time. Was it always the same number? Notice that each of these values has been added to the dotplot on the right (Technical details In this case, it's equivalent to looking at the number of blue cards in the yuwn group or the difference in conditional proportions as the statistic of interest.) 16. Uke this applet to conduct 1,000 repetitions of this simulation: Change the Number of Shuffles from 1 to 995 (for a total of 1,000) and press Shuffle. The applet produces a dotplot showing the null distribution for the difference in proportions of yawners between the two groups. Map this simulation to the research study Null hypothesis One repetition Statist 17. Look more closely at the simulated null distribution for the difference in proportions of yawners between the two groups. Is this null distribution centered around 0? Explain why this makes sense. (Hint: Think about the choice of statistic and about the null hypothesis, which was the basis of the simulation analysis.) Drott 6/10 b. Is the observed value of the Natistic from the MythBuster study (0.16) out in the tail of this null distribution or not so much in other words, does the observed result appear to be typical or surprising when the null hypothesis (that yawning is not conta gious) is truet As you know, you can assess the strength of evidence against the null hypothesis by calculating a p value. To calculate a p-value from this null distribution, you will count the number of repetitions that produced a simulated difference in proportions equal (choose more or less) 18. Enter the observed difference in the sample proportions in the Count Samples box and choose the direction from the pull-down menu and press Count Check whether the shaded region of the dotplot corresponds with your answer to 17. Then report this approximate p-value Interpret this p value by filling in the following blanks Under the assumption that if we repeatedly many, many times, the probability we would obtain a difference in conditional proportions as or more extreme than is about . Evaluate this p value: Using guidelines for assessing the strength of evidence from p-values, would you conclude that the MythBusters result provides much evidence that yawning is contagious? We have a small confession to make. We fudged the data from this study a bit. The actual data showed that 10 of the 34 subjects in the yawn seed group yawned themselves, and 4 of the 16 in the control group yawned 21. Recalculate the conditional proportions who yawned for these data Proportion who yawned in the "yawn seed" group Proportion who yawned in the control group Difference in conditional proportions (yawn seed-control) 22. How has your observed statistic changed from the originally presented data? Sealer Same O Larger O 21. Before you carry out the interne using this post confession obr a tit, let make some predictions How do you expect the p value and strength of evidence to change from your earlier analysis Cinde your choices below and then explain why you circled what you did p-value Sealer 0 Same O larger Strength of evidence 7/10 O Same Stronger o 24. Conduct a simation analysis to check your answer predictions from the previous question. To do this, enter the new values into the four bones of the table and press Use Table. Then ask for 1.000 repetitions in your simulation analysis. Enter the new observed value of the statistic and then press the Count button. Report the approximate p-value and summarize your conclusion in terms of strength of evidence that yawning is contagious Estimation Because the MythBusters data did not reveal a significant difference between the groups, it's less important than usual to estimate the parameter value. But we can still use the simulation results to estimate 95% confidence interval for the relevant parameter. Keep in mind that the relevant parameter is now the difference in the long run probabilities between the yawn seed treatment and the ne yawn seed treatment. 25. The parameter of interest in this yawning study can be expressed in symbol Describe what this parameter means in words 1. Report again) the observed value of the statistic from the MythBusters actual data (Hit Recall that the statistic is the difference in conditional proportions between the two groups) The observed value of this statistic is your best estimate of the unknown parameter value. But we should produce an interval estimate centered on this observed value. To do that we again need to consider the chance variability in the statistic c. From the simulation analysis that you conducted on the postconfession Myth busters data, what was the standard deviation of the null distribution? To enter special characters and formatting, use "Ctrl+Ein Windows and Cmd + Ein Mac 8/10 d. Determine endpoints of a 95%25D confidence interval for the difference by taking the observed value of the statistic + 2 standard deviations e. Does this confidence interval include only positive values, only negative values, or nero as well as positive and negative values? Explain the importance of your answer to part(e) in terms of whether the data provide evidence that subjects who experience a yawn seed are more likely to yawn than those who do not experience a yawn seed? STEP 5: Formulate conclusions. 26. The MythBusters hosts concluded from their study that there is little doubt, yawning seems to be contagious. Based on your simulation analysis of their data, considering the issue of statistical significance, do you agree with this conclusion? Explain your answer as if to the hosts, without using statistical jargon. Be sure to include in your answer an explanation for why you conducted the simulation analysis and what the analysis revealed about the research question. 27. If you had decided that the two groups differed significantly, would you have been just fied in drawing a cause and effect conclusion between the yawn seed and an increased probability of yawning? Explain, based on how the study was conducted 2. Based on how the sample was selected, to what larger population would you feel comfort able generalizing the results of this study? Justify your answer 20. Think about the difference between these two possible conclusions L The data strongly suggest that yawning is not contagious The data do not provide convincing evidence to suggest that yawning is contagious Explain why these conclusions are not the same. Also indicate which one is the more appropriate conclusion from your analysis and explain why 30. As we discussed in Chapter 2, in every statistical analysis it is possible to make a type lor Type Il error. Identify which error you might be making here, describe it in context, and briefly identify the consequences. STEP 6: Look back and ahead. 31. Critique the design and conclusion of this study, Were there any limitations, such as how the subjects were selected or how the measurements were recorded? Was the sample size large enough? Did you observe a result of practical value? Discuss how you might address a few of these limitations Surest how you might design a follow-up study to investigate whether yawning is contagious. Address details such as how to ensure that the yawn seed is noticed, how long to wait for the subject's yawn to be connected to the seed, and how to select/recruit subjects. Effect of sample size Now let's suppose that this yawning study had involved 500 people, 10 times as many as the actual study, Let's also suppose that the conditional proportions who yawned in each group were identical to the actual study. The 2 x 2 table would therefore be: Yawn seed planted Yawn seed not planted Total Subject owned Subject did not yaw 32. Before you conduct a simulation analysis, indicate how you expect the following to change a Difference in conditional proportions Smaller O Same O Larger o b. p value Smaller Same O Larger O c. Strength of evidence that yawning is contagious Weaker O Same Ol Stronger O d. Test decision at the 0.05 significance level Reject rull forlike before) Ol Fal to reject rullas before) 33. Use the Two Proportions applet, again entering the appropriate table of data first to con duct a simulation analysis. Report the approximate p value and summarize your conclu sion in terms of strength of evidence that yawning is contagious. Also indicate whether you would find strong evidence against the null hypothesis at the 0.05 significance level Summarize how the 10-fold increase in the sample size has changed your conclusions. Do you have stronger evidence that yawning is contagious? Is the evidence now very strong that yawning is contagious? Relative risk In Section 5.1 we introduced you to the relative risk as an alternative statistic to summarize the relationship between two binary variables 35. What value of the relative risk indicates no association between the two variables in this study? 36. State the null and alternative hypotheses for the yawning study in terms of the relative risk. We will now apply the 5 strategy using the relative risk. Use the sample sire of 500 people you used in 32 through 234 for the following questions 37. Statistic. Calculate, and then interpret the observed value of the relative risk by dividing the conditional proportion of yawners in the yawn seed group compared to the conditional proportion of yawners in the no yawn seed group In the Two Proportions applet, change the statistic to Relative risk in the Statistic pull down menu. Confirm that the statistic matches your answer to #37 38. Simulate. If you still have your shuffles from 33 use them, otherwise generate 1,000 new shuffles. Find the p-value using the relative risk. Compare this p-value to the p-value you obtained in.33