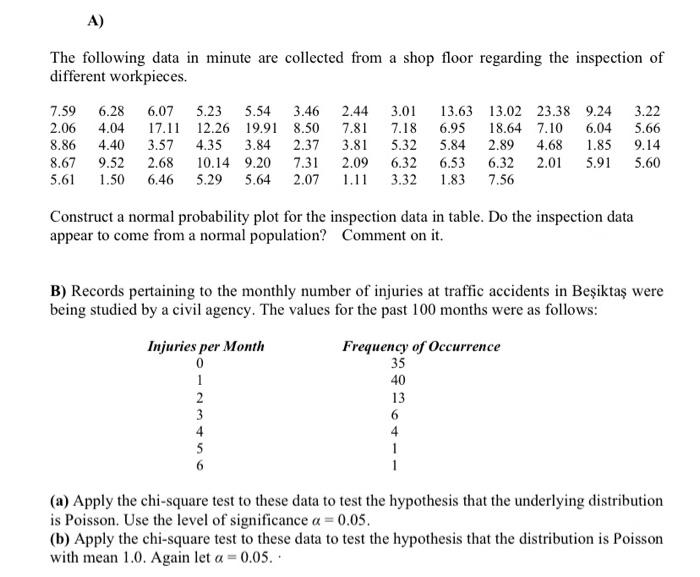
Question: A) The following data in minute are collected from a shop floor regarding the inspection of different workpieces. 7.59 6.28 6.07 5.23 5.54 3.46 2.44

A) The following data in minute are collected
A) The following data in minute are collected from a shop floor regarding the inspection of different workpieces. 7.59 6.28 6.07 5.23 5.54 3.46 2.44 3.01 13.63 13.02 23.38 9.24 3.22 2.06 4.04 17.11 12.26 19.91 8.50 7.81 7.18 6.95 18.64 7.10 6.04 5.66 8.86 4.40 3.57 4.35 3.84 2.37 3.81 5.32 5.84 2.89 4.68 1.85 9.14 8.67 9.52 2.68 10.14 9.20 7.31 2.09 6.32 6.53 6.32 2.01 5.91 5.60 5.61 1.50 6.46 5.29 5.64 2.07 1.11 3.32 1.83 7.56 Construct a normal probability plot for the inspection data in table. Do the inspection data appear to come from a normal population? Comment on it. B) Records pertaining to the monthly number of injuries at traffic accidents in Beikta were being studied by a civil agency. The values for the past 100 months were as follows: Injuries per Month Frequency of Occurrence 0 35 1 40 2 13 3 6 4 4 5 (a) Apply the chi-square test to these data to test the hypothesis that the underlying distribution is Poisson. Use the level of significance a = 0.05. (b) Apply the chi-square test to these data to test the hypothesis that the distribution is Poisson with mean 1.0. Again let a = 0.05

Step by Step Solution

There are 3 Steps involved in it

1 Expert Approved Answer
Step: 1 Unlock blur-text-image
Question Has Been Solved by an Expert!

Get step-by-step solutions from verified subject matter experts

Step: 2 Unlock
Step: 3 Unlock

Students Have Also Explored These Related General Management Questions!