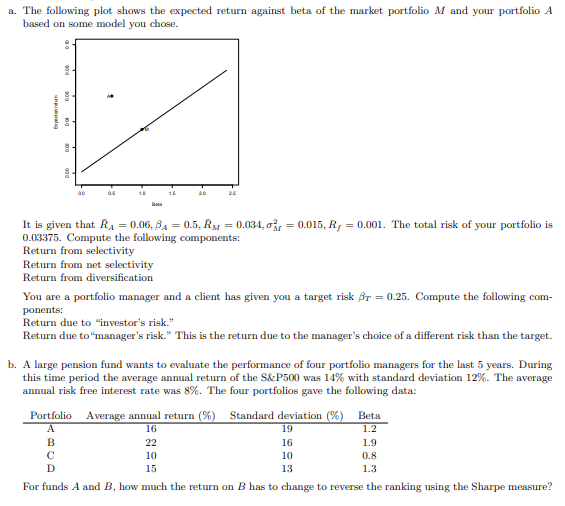
Question: a. The following plot shows the expected return against beta of the market portfolio M and your portfolio A based on some model you chose.

a. The following plot shows the expected return
a. The following plot shows the expected return against beta of the market portfolio M and your portfolio A based on some model you chose. Spiderdun It is given that RA = 0.06, 84 = 0.5, Ry = 0.034, of, = 0.015, Ry =0.001. The total risk of your portfolio is 0.03375. Compute the following components: Return from selectivity Return from net selectivity Return from diversification You are a portfolio manager and a client has given you a target risk Ar = 0.25. Compute the following com- ponents: Return due to "investor's risk." Return due to "manager's risk." This is the return due to the manager's choice of a different risk than the target. b. A large pension fund wants to evaluate the performance of four portfolio managers for the last 5 years. During this time period the average annual return of the S&P500 was 14% with standard deviation 12%. The average annual risk free interest rate was 8%. The four portfolios gave the following data: Portfolio Average annual return (%) Standard deviation (%) Beta 16 19 1.2 22 16 1.9 10 10 0.8 15 13 1.3 For funds A and B, how much the return on B has to change to reverse the ranking using the Sharpe measure

Step by Step Solution

There are 3 Steps involved in it

1 Expert Approved Answer
Step: 1 Unlock blur-text-image
Question Has Been Solved by an Expert!

Get step-by-step solutions from verified subject matter experts

Step: 2 Unlock
Step: 3 Unlock

Students Have Also Explored These Related Finance Questions!