

Question: (a) The following table shows data collected on the time to failure (in days) for a particular machine at a manufacturing plant. Plot the histogram

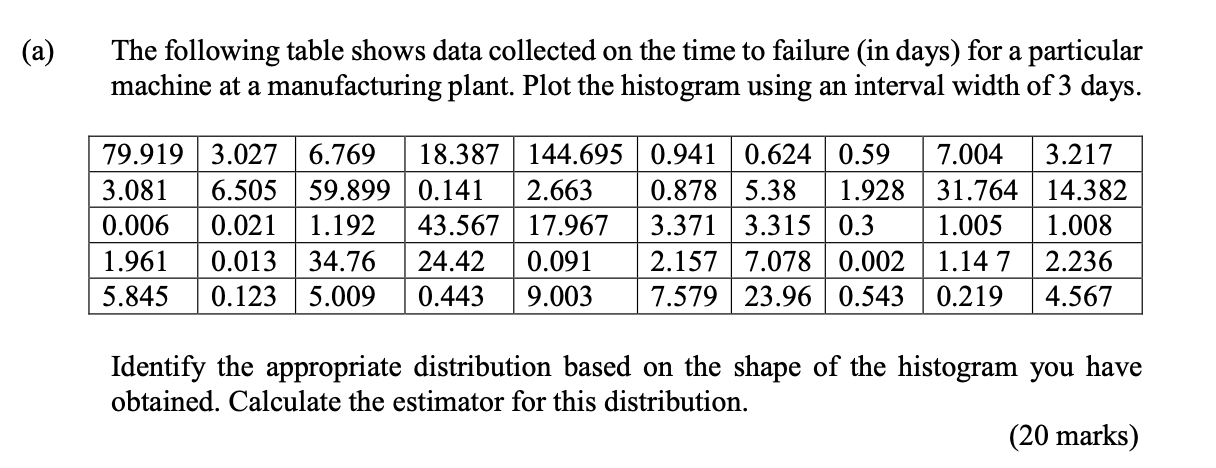
(a) The following table shows data collected on the time to failure (in days) for a particular machine at a manufacturing plant. Plot the histogram using an interval width of 3 days. 59.899 0.006 1.961 0.013 34.76 24.42 0.091 2.157 7.078 0.002 1.147 2.236 5.845 0.123 5.009 0.443 9.003 7.579 23.96 0.543 0.219 4.567 Identify the appropriate distribution based on the shape of the histogram you have obtained. Calculate the estimator for this distribution. (20 marks)
Step by Step Solution
There are 3 Steps involved in it
1 Expert Approved Answer
Step: 1 Unlock

Question Has Been Solved by an Expert!
Get step-by-step solutions from verified subject matter experts
Step: 2 Unlock
Step: 3 Unlock