

Question: This is a study case in all the photos the SIPOC diagram bellow is incomplete and wrong I need to fix it Perfect Match TEAM
This is a study case in all the photos
the SIPOC diagram bellow is incomplete and wrong I need to fix it
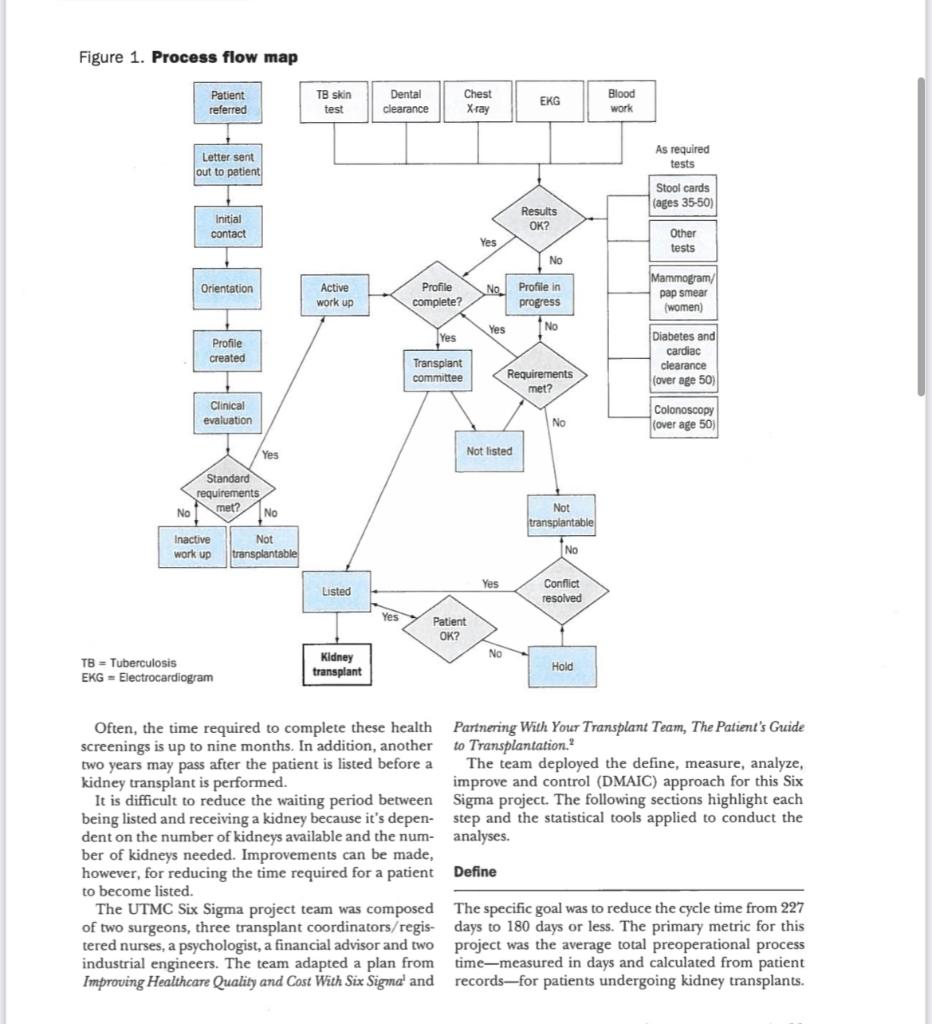
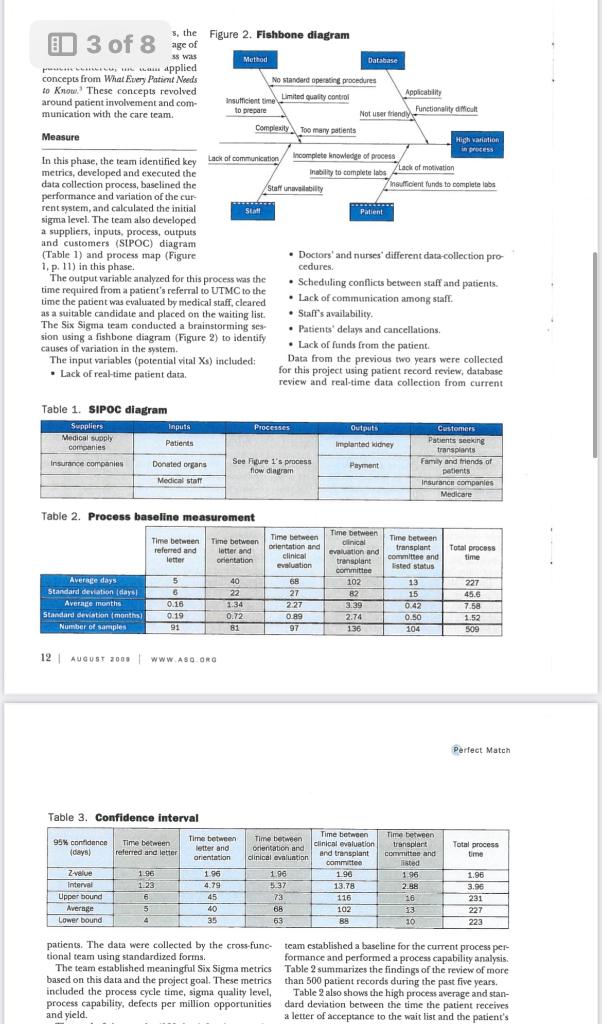
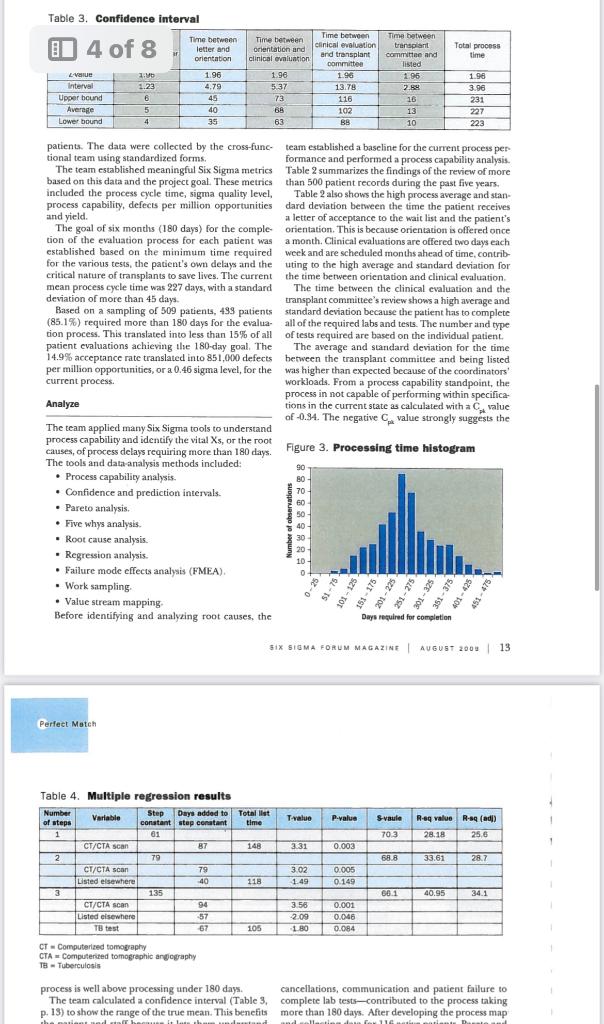
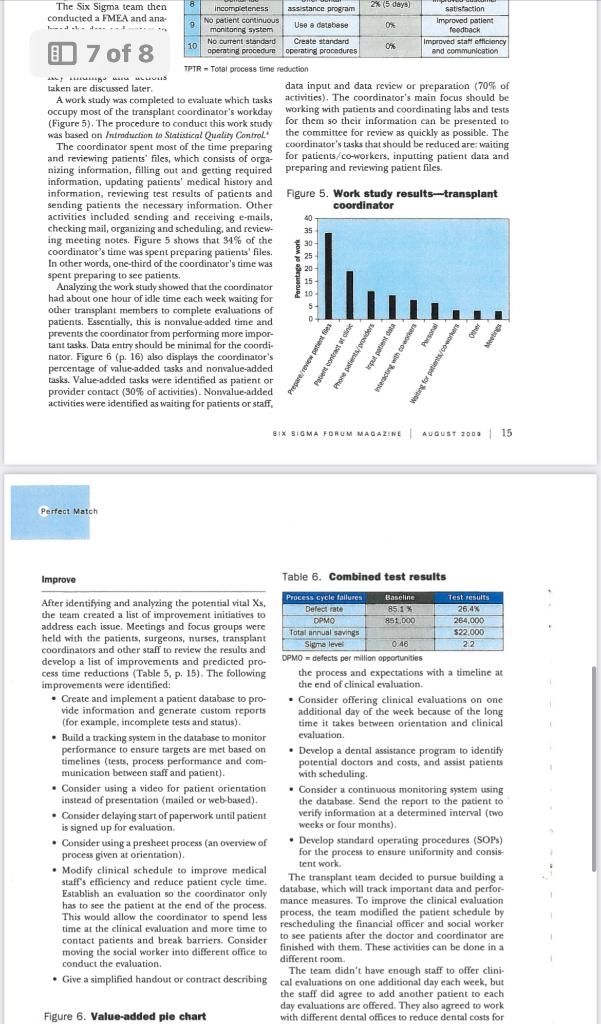
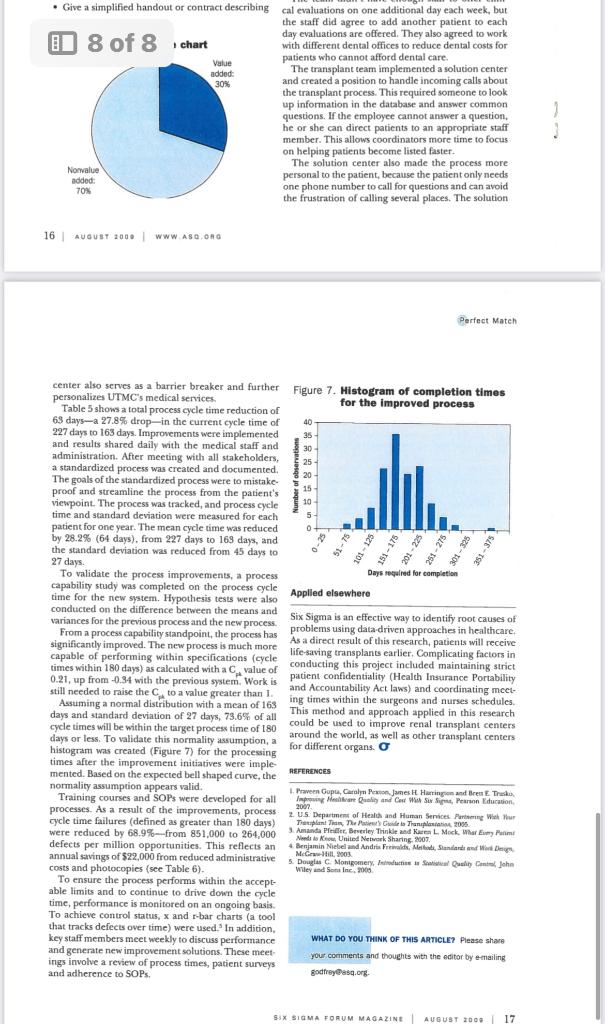
Perfect Match TEAM APPLIES n January 2008, the University of Toledo Medical Center (UTMC) in northwest Ohio collaborated with the University of Toledo's Industrial SIX SIGMA TO Engineering Department to analyze and improve the preoperational processes for patients undergoing kidney transplants. Six Sigma was applied to the REDUCE TIME project, and the following goals were established: IT TAKES TO - Optimize cycle times. QUALIFY PATIENTS - Enhance customer satisfaction. - Improve efficiencies. FOR KIDNEY - Reduce costs. TRANSPLANTS - Streamline administrative processes. - Eliminate errors. - Improve protocol execution and effectiveness. The project's primary metric was the number of days required from the date a patient was referred to UTMC for a kidney transplant to the date the hospital staff declared the patient a suitable transplant candidate. The research By Matthew was needed and the project selected because of an increase in the number of Franchetti and year because of the increased service area for UTMC. Because of a waiting list of nearly 500 patients, it was determined a reduced cycle time would save lives. Kyle Bedal, Background and terminology University of For more than 30 years, UTMC has performed adult and pediatric kidney Toledo transplants as one of the treatment options for end-stage renal disease. Since UTMC's first kidney transplant operation in 1972, more than 1,500 kidney transplant operations have been performed there, with an average patient survival rate of 98% and a graft survival rate of 94%. The program relies on advanced surgical techniques-including laparoscopic kidney donation, improved anti-rejection medications and high-quality patient care-to make it one of the most successful programs in the country. There are a number of steps patients must complete before receiving a kidney transplant. Generally, the patient must be referred to a medical center and complete required labs and tests to determine if he or she is suitable. The labs and tests are usually similar among all transplant centers and among patients. The labs include tuberculosis (TB) tests, dental clearance, a colonoscopy, chest X-rays, electrocardiography tests, stool samples, blood work, mammograms, pap smears and diabetes tests. Once the patient fulfills the requirements, a committee reviews the results and determines whether the patient is a good candidate. The patient is then allowed to receive a kidney; this is called being "listed," or placed on the waiting list. Fil TB EK Often, the time required to complete these health Partnering With Your Transplant Team, The Patient's Guide screenings is up to nine months. In addition, another to Transplantation. 2 two years may pass after the patient is listed before a The team deployed the define, measure, analyze, kidney transplant is performed. improve and control (DMAIC) approach for this Six It is difficult to reduce the waiting period between Sigma project. The following sections highlight each being listed and receiving a kidney because it's depen- step and the statistical tools applied to conduct the dent on the number of kidneys available and the num- analyses. ber of kidneys needed. Improvements can be made, however, for reducing the time required for a patient Define to become listed. The UTMC Six Sigma project team was composed The specific goal was to reduce the cycle time from 227 of two surgeons, three transplant coordinators/regis- days to 180 days or less. The primary metric for this tered nurses, a psychologist, a financial advisor and two project was the average total preoperational process industrial engineers. The team adapted a plan from time-measured in days and calculated from patient Improving Healthcare Quality and Cost With Six Sigma' and records-for patients undergoing kidney transplants. and customers (SIPOC) diagram (Table 1) and process map (Figure - Doctors' and nurses' different data-collection pro1, p. 11) in this phase. cedures. The output variable analyzed for this process was the time required from a patient's referral to UTMC to the - Scheduling conflicts between staff and patients. time the patient was evaluated by medical staff, cleared - Lack of communication among staff. as a suitable candidate and placed on the waiting list. - Staff's availability. The Six Sigma team conducted a brainstorming ses- - Patients' delays and cancellations. sion using a fishbone diagram (Figure 2) to identify causes of variation in the system. - Lack of funds from the patient. The input variables (potential vital Xs ) included: Data from the previous two years were collected for this project using patient record review, database review and real-time data collection from current Table 1. SIPoc diagram Table 2. Process baseline measurement 12 A AUOut zoos | WWWABO.arO Perfect Mateh Table 3. Confidence interval patients. The data were collected by the cross-func- team established a baseline for the current process pertional team using standardized forms. formance and performed a process capability analysis. The team established meaningful Six Sigma metrics Table 2 summarizes the findings of the review of more based on this data and the project goal. These metrics than 500 patient records during the past five years. included the process cycle time, sigma quality level, Table 2 also shows the high process average and stanprocess capability, defects per million opportunities dard deviation between the time the patient receives and yield. a letter of acceptance to the wait list and the patient's Table 3. Confidence interval patients. The data were collected by the cross-func- team established a baseline for the current process pesbased on this data and the project goal. These metrics than 500 patient records during the past five years. included the process cycle time, sigma quality level, Table 2 also shows the high process average and stanprocess capability, defects per million opportunities dard deviation between the time the patient receives and yield. a letter of acceptance to the wait list and the patient's The goal of six months (180 days) for the comple- orientation. This is because orientation is offered once tion of the evaluation process for each patient was a month. Clinical evaluations are offered two days each established based on the minimum time required week and are scheduled months ahead of time, contribfor the various tests, the patient's own delays and the uting to the high average and standard deviation for critical nature of transplants to save lives. The current the time between orientation and clinical evaluation. mean process cycle time was 227 days, with a standard The time between the clinical evaluation and the deviation of more than 45 days. transplant committee's review shows a high average and Based on a sampling of 509 patients, 499 patients standard deviation because the patient has to complete (85.1\%) required more than 180 days for the evalua- all of the required labs and tests. The number and type tion process. This translated into less than 15% \% all of tests required are based on the individual patient. patient evaluations achieving the 180-day goal. The The average and standard deviation for the time 14.9% acceptance rate translated into 851,000 defects between the transplant committee and being listed per million opportunities, or a 0.46 sigma level, for the was higher than expected because of the coordinators' current process. Workloads. From a process capability standpoint, the, process in not capable of performing within specifica. Analyze tions in the current state as calculated with a Cpt value of -0.94 . The negative Cpi value strongly suggests the The team applied many Six Sigma tools to understand process capability and identify the vital X5, or the root causes, of process delays requiring more than 180 days. Figure 3. Processing time histogram The tools and datnanalysis methods included: - Process capability analysis. - Confidence and prediction intervals. - Pareto analysis. - Five whys analysis. - Root cause analysis. - Regression analysis. - Failure mode effects analysis (FMEA). - Work sampling. - Value stream mapping Before identifying and analyzing root causes, the Perfect Mateh Table 4. Multiple refression results CT= Computerized tomogepty CTA = Computerited tomographic angiegraphy TA= Tuberculosis process is well above processing under 180 days. cancellations, communication and patient failure to The team calculated a confidence interval (Table 3 , complete lab tests-contributed to the process taking p. 13) to show the range of the true mean. This benefits more than 180 days. After developing the process map The Six Sigma team then conducted a FMEA and ana- 7 of 8 TPR = Tosal process time reduction taken are discused later. data input and data revicw or preparation (70% of A workstudy was completed to evaluate which tasks activities). The coordinator's main focus should be occupy most of the transplant coordinaror's workday working with patients and coordinating labs and tests (Figure 5). The procedure to conduct this workstudy for them so their information can be presented to was based on Intraduction to Sintistical Quality Contral." the committee for review as quickly as possible. The The coordinator spent most of the time preparing coordinator's tasks that should be reduced are: waiting and reviewing patients' files, which consists of orga- for patients/co-workers, inputting patient data and nizing information, filling out and getting required preparing and reviewing patient files. information, updating patients' medical history and information, reviewing test results of patients and Figure 5. Work study results-transplant sending patients the necessary information. Other coordinator activities included scnding and receiving e-mails, checking mail, organizing and scheduling, and reviewing meeting notes. Figure 5 shows that 34% of the coordinator's time was spent preparing patients' files. In other words, one-third of the coordinator's time was spent preparing to see patients. Analyzing the work study showed that the coordinator had about one hour of idle time each week waiting for other transplant members to complete evaluations of patients. Essentially, this is nonvalue-added time and prevents the coordinator from performing more important tasks. Data entry should be minimal for the coordinator. Figure 6 (p. 16) also displays the coordinator's percentage of value-added tasks and nonvalue-added rasks. Valte-added tasks were identified as patient or provider contact ( 30% of activities). Nonvalue-added activities were identified as waiting for patients or staff, Improve Table 6. Combined test results After identifying and analyaing the potential vital Xs, the team created a list of improvement initiatives to address each issue. Meetings and focus groups were held with the patients, surgeons, nurses, transplant coordinators and other staff to review the results and develop a list of improvements and predicted pro- Dpmo = defects per million opportunties cess time reductions (Table 5,p. 15). The following the process and expectations with a timeline at improvements were identified: the end of clinical evaluation. - Create and implement a patient database to pro- Consider offering clinical evaluations on one vide information and generate custom reports additional day of the week because of the long (for example, incomplete tests and status). time it takes between orientation and clinical - Build a tracking system in the database to monitor evaluation. performance to ensure targets are met based on - Develop a dental assistance program to identify timelines (tests, process performance and comwith scheduling. - Consider using a video for patient orientation - Consider a continuous monitoring s)stem using instead of presentation (mailed or web-based). the database. Send the report to the patient to - Consider delaying start of paperwork until patient verify information at a determined interval (two is signed up for evaluation. weeks or four months). - Consider using a presheet process (an overview of - Develop standard operating procedures (SOps) process given at orientation). for the process to ensire unifornity and consis- - Modify clinical schedule to improve medical tent work. staff's efficiency and reduce patient cycle time. The transplant team decided to pursue building a Establish an evaluation so the coordinator only database, which will track important data and perforhas to see the patient at the end of the process. mance measures. To improve the clinical evaluation This would allow the coordinator to spend less process, the team modified the patient schedule by time at the clinical evaluation and more time to rescheduling the financial officer and social worker contact patients and break barriers. Consider to see patients after the doctor and coordinator are moving the social worker into different office to finished with them. These activities can be done in a conduct the evaluation different room. - Give a simplified handout or contract describing The team didn't have enough staff to offer clinical evaluations on one additional day each week, but the staff did agree to add another patient to each day evaluations are offered. They also agreed to work Figure 6. Value-added pie chart with different dental offices to reduce dental costs for - Give a simplified handout or contract describing cal evaluations on one additional day each week, but the staff did agree to add another patient to each E1 8% i chart day evaluations are offered. They also agreed to work with different dental offices to reduce dental costs for patients who cannot afford dental care. The transplant team implemented a solution center and created a position to handle incoming calls about the transplant process. This required someone to look up information in the database and answer common questions. If the employee cannot answer a question. he or she can direct patients to an appropriate staff member. This allows coordinators more time to focus on helping patients become listed faster. The solution center also made the process more personal to the patient, because the patient only needs one phone number to call for questions and can avoid the frustration of calling several places. The solution 16 | AuOUer 2000 I WWW Aso.ona Perfect Mateh center also serves as a barrier breaker and further Figure 7. Histogram of completion times personalizes UTMC's medical services. personalizes UTMC's medical services. Table 5 shows a total process cycle time reduction of 63 days - a 27.8% drop-in the current cycle time of 227 days to 163 days. Improvements were implemented and results shared daily with the medical staff and administration. After meeting with all stakeholders, a standardized process was created and documented. The goals of the standardized process were to mistakeproof and streamline the process from the patient's viewpoint. The process was tracked, and process cycle time and standard deviation were measured for each patient for one year. The mean cycle time was reduced by 28.2% ( 64 days) from 297 days to 163 days, and the standard deviation was reduced from 45 days to 27 days. To validate the process improvements, a process capability study was completed on the process cycle time for the new system. Hypothesis tests were also conducted on the difference berween the means and variances for the previous process and the new process. Six Sigma is an effective way to identify root causes of From a process capability standpoint, the process has problems using data-driven approaches in healthcare. significantly improved. The new process is much more As a direct result of this research, patients will receive capable of performing within specifications (cycle life-saving transplants earlier. Complicating factors in times within 180 days) as calculated with a CFe value of conducting this project included maintaining strict 0.21 , up from -0.34 with the previous system. Work is patient confidentiality (Healch Insurance Portability still needed to raise the C to a value greater than I. and Accountability Act laws) and coordinating meetAssuming a normal distribution with a mean of 163 ing times within the surgeons and nurses schedules. days and standard deviation of 27 days, 73.6% of all This method and approach applied in this research cycle times will be within the target procesx time of 180 around the world, as well as other transplant centers days or less. To validate this normality assumption, a for different organs. histogram was created (Figure 7) for the processing times after the improvement initiatives were implemented. Based on the expected bell shaped curve, the normality assumption appears valid: were reduced by 68.9\%-from 851,000 to 264,000 3. Amande Pfeimer Brweriey Trinker asd Kuers L- Mock Mhar Eumy Fuamt defects per million opportunities. This reflects an annual savings of $22,000 from reduced administrative costs and photocopies (see Table 6). To ensure the process performs within the acceptable limits and to continue to drive down the cycle time, performance is monitored on an ongoing basis. To achieve control status, x and r-bar charts (a tool that tracks defects over time) were used. In addition, key staff members meet weekly to discuss performance WHAT DO YOU THNN OF THIS ARTCLE? Please share and generate new improvement solutions. These meetings involve a review of process times, patient surveys your comments and thoughts with the aditar by emailing and adherence to SOPs. Table 1. SIPOC diagram
Step by Step Solution
There are 3 Steps involved in it

Get step-by-step solutions from verified subject matter experts