

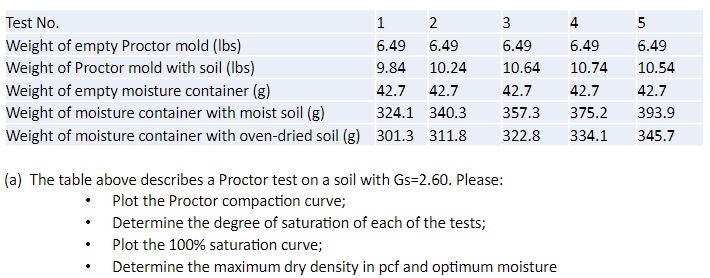
Question: ( a ) The table above describes a Proctor test on a soil with G s = 2 . 6 0 . Please: Plot the
a The table above describes a Proctor test on a soil with Please:
Plot the Proctor compaction curve;
Determine the degree of saturation of each of the tests;
Plot the saturation curve;
Determine the maximum dry density in pcf and optimum moisture
Step by Step Solution
There are 3 Steps involved in it
1 Expert Approved Answer
Step: 1 Unlock

Question Has Been Solved by an Expert!
Get step-by-step solutions from verified subject matter experts
Step: 2 Unlock
Step: 3 Unlock