

Question: a) The table below includes monhtly data for a motel occupancy of a region. Provide estimates from January to July of 2001 by using two
 a) The table below includes monhtly data for a motel occupancy of a region. Provide estimates from January to July of 2001 by using two models: 1) A single exponential smoothing with =0.6; 2) Trend Naive Model. Calculate MPE for each model.
| Month | Actual |
| 01.01.2001 | 748 |
| 01.02.2001 | 773 |
| 01.03.2001 | 814 |
| 01.04.2001 | 767 |
| 01.05.2001 | 729 |
| 01.06.2001 | 749 |
| 01.07.2001 | 681 |
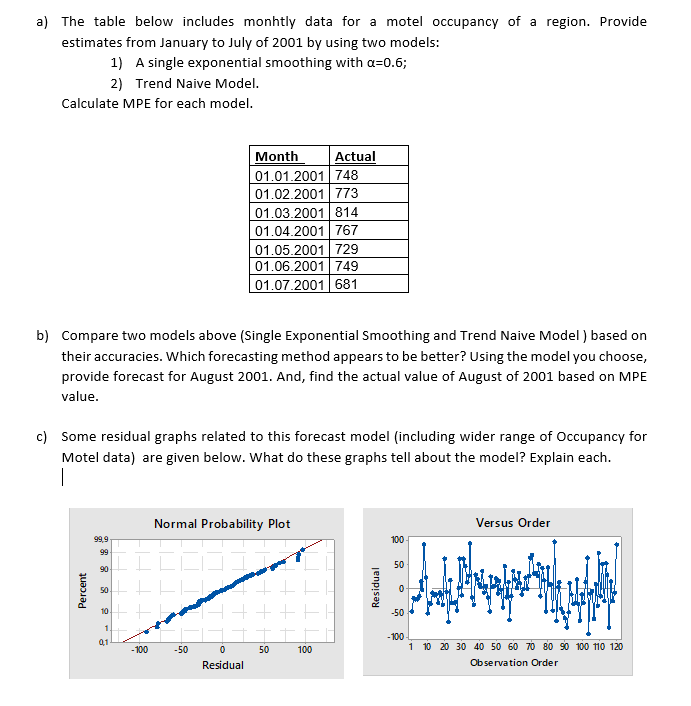
a) The table below includes monhtly data for a motel occupancy of a region. Provide estimates from January to July of 2001 by using two models: 1) A single exponential smoothing with =0.6; 2) Trend Naive Model. Calculate MPE for each model. b) Compare two models above (Single Exponential Smoothing and Trend Naive Model ) based on their accuracies. Which forecasting method appears to be better? Using the model you choose, provide forecast for August 2001. And, find the actual value of August of 2001 based on MPE value. c) Some residual graphs related to this forecast model (including wider range of Occupancy for Motel data) are given below. What do these graphs tell about the model? Explain each
Step by Step Solution
There are 3 Steps involved in it

Get step-by-step solutions from verified subject matter experts