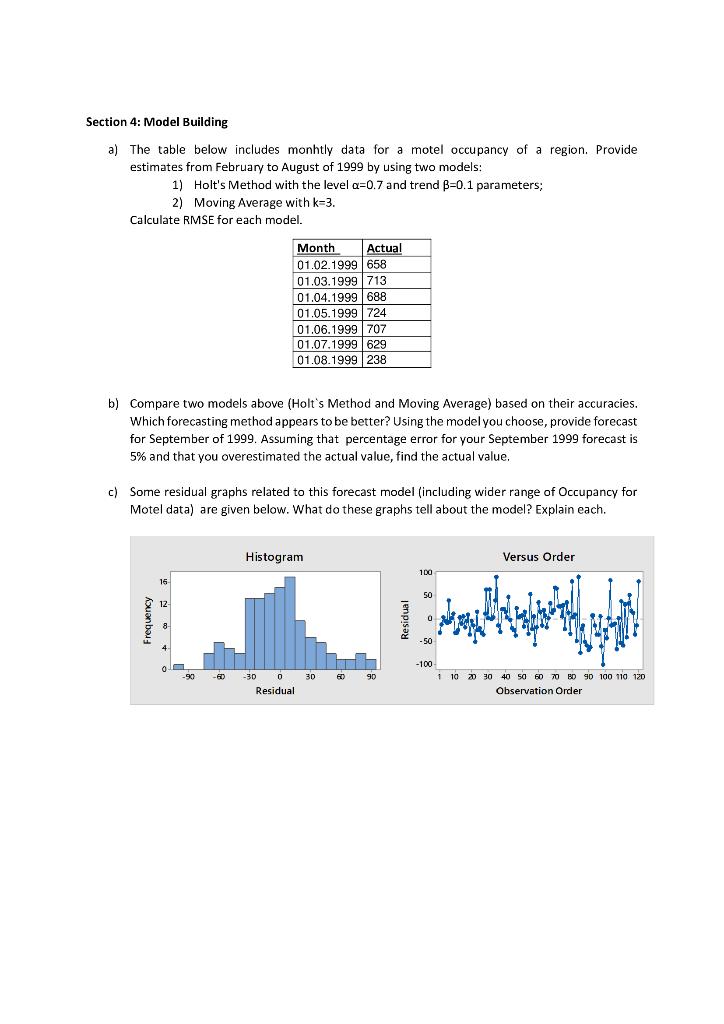
Question: Section 4: Model Building a) The table below includes monhtly data for a motel occupancy of a region. Provide estimates from February to August of

Section 4: Model Building a) The table below

Section 4: Model Building a) The table below includes monhtly data for a motel occupancy of a region. Provide estimates from February to August of 1999 by using two models: 1) Holt's Method with the level a=0.7 and trend B=0.1 parameters; 2) Moving Average with k=3. Calculate RMSE for each model. Month Actual 01.02.1999 658 01.03.1999 713 01.04.1999 688 01.05.1999 724 01.06.1999 707 01.07.1999 629 01.08.1999 238 b) Compare two models above (Holt's Method and Moving Average) based on their accuracies. Which forecasting method appears to be better? Using the model you choose, provide forecast for September of 1999. Assuming that percentage error for your September 1999 forecast is 5% and that you overestimated the actual value, find the actual value. c) Some residual graphs related to this forecast model (including wider range of Occupancy for Motel data) are given below. What do these graphs tell about the model? Explain each. Histogram Versus Order 100 50 Frequency 1 0 -50 0 -100 -62 30 90 30 0 Residual 1 10 20 30 40 50 60 70 80 90 100 110 120 Observation Order Section 4: Model Building a) The table below includes monhtly data for a motel occupancy of a region. Provide estimates from February to August of 1999 by using two models: 1) Holt's Method with the level a=0.7 and trend B=0.1 parameters; 2) Moving Average with k=3. Calculate RMSE for each model. Month Actual 01.02.1999 658 01.03.1999 713 01.04.1999 688 01.05.1999 724 01.06.1999 707 01.07.1999 629 01.08.1999 238 b) Compare two models above (Holt's Method and Moving Average) based on their accuracies. Which forecasting method appears to be better? Using the model you choose, provide forecast for September of 1999. Assuming that percentage error for your September 1999 forecast is 5% and that you overestimated the actual value, find the actual value. c) Some residual graphs related to this forecast model (including wider range of Occupancy for Motel data) are given below. What do these graphs tell about the model? Explain each. Histogram Versus Order 100 50 Frequency 1 0 -50 0 -100 -62 30 90 30 0 Residual 1 10 20 30 40 50 60 70 80 90 100 110 120 Observation Order

Step by Step Solution

There are 3 Steps involved in it

1 Expert Approved Answer
Step: 1 Unlock blur-text-image
Question Has Been Solved by an Expert!

Get step-by-step solutions from verified subject matter experts

Step: 2 Unlock
Step: 3 Unlock

Students Have Also Explored These Related General Management Questions!