

Question: a) The upper and lower 3-sigma control chart limits are: UCLp=(enteryourresponseasanumberbetween0and1,roundedtothreedecimalplaces).LCLp=(enteryourresponseasanumberbetween0and1,roundedtothreedecimalplaces). b) Given the limits in part a, is the process in control for the
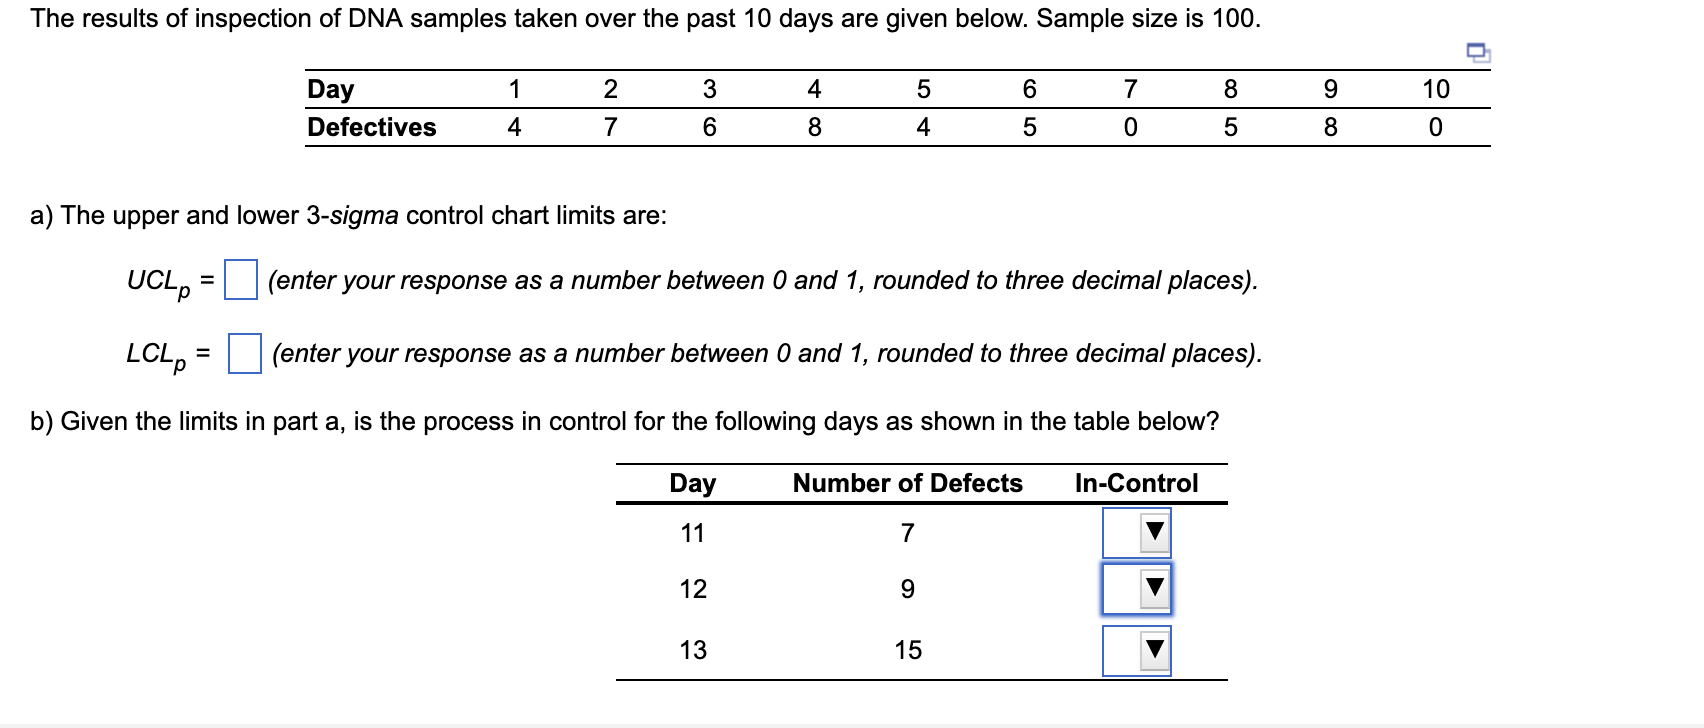
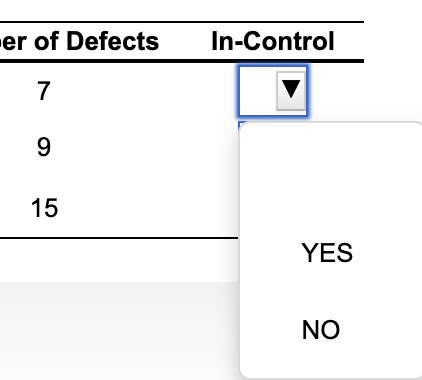
a) The upper and lower 3-sigma control chart limits are: UCLp=(enteryourresponseasanumberbetween0and1,roundedtothreedecimalplaces).LCLp=(enteryourresponseasanumberbetween0and1,roundedtothreedecimalplaces). b) Given the limits in part a, is the process in control for the following days as shown in the table below? \begin{tabular}{cc} \hline er of Defects & In-Control \\ \hline 7 & \\ 9 & \\ 15 & YES \\ \hdashline & NO \end{tabular}
Step by Step Solution
There are 3 Steps involved in it
1 Expert Approved Answer
Step: 1 Unlock

Question Has Been Solved by an Expert!
Get step-by-step solutions from verified subject matter experts
Step: 2 Unlock
Step: 3 Unlock