

Question: a through i please 4 5 4 6 8 6 ola 4 0 8 0 0 0 QUESTION 24 (10 points) - Process Analysis with
a through i please
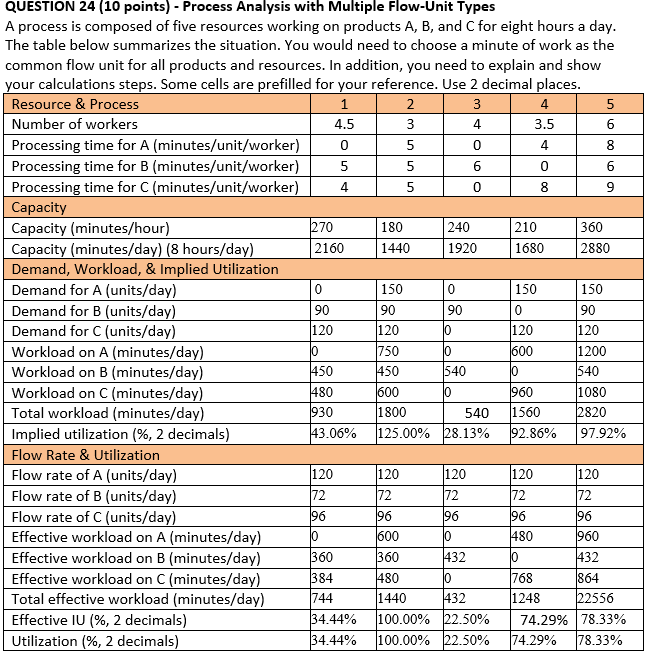
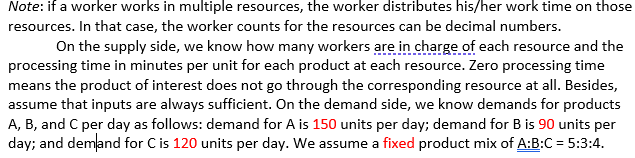
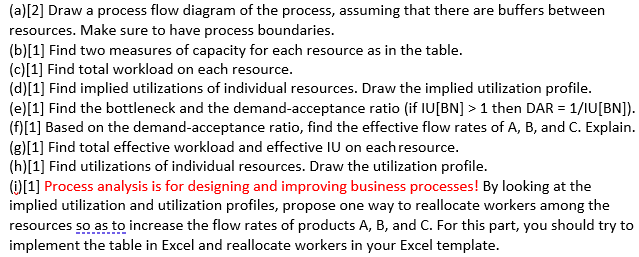
4 5 4 6 8 6 ola 4 0 8 0 0 0 QUESTION 24 (10 points) - Process Analysis with Multiple Flow-Unit Types A process is composed of five resources working on products A, B, and C for eight hours a day. The table below summarizes the situation. You would need to choose a minute of work as the common flow unit for all products and resources. In addition, you need to explain and show your calculations steps. Some cells are prefilled for your reference. Use 2 decimal places. Resource & Process 1 2 3 Number of workers 4.5 3 3.5 Processing time for A (minutes/unit/worker) 0 5 0 4 Processing time for B (minutes/unit/worker) 5 0 6 Processing time for C(minutes/unit/worker) 5 Capacity Capacity (minutes/hour) 270 180 240 210 360 Capacity (minutes/day) (8 hours/day) 2160 1440 1920 1680 2880 Demand, Workload, & Implied Utilization Demand for A (units/day) 150 150 150 Demand for B (units/day) 90 90 90 90 Demand for C(units/day) 120 120 120 120 Workload on A (minutes/day) 750 1200 Workload on B (minutes/day) 450 450 540 Workload on C(minutes/day) 1600 10 960 1080 Total workload (minutes/day) 1800 540 1560 2820 Implied utilization (%, 2 decimals) 43.06% 125.00% 28.13% 92.86% 97.92% Flow Rate & Utilization Flow rate of A (units/day) 120 [120 120 120 120 Flow rate of B (units/day) 72 72 72 72 72 Flow rate of C (units/day) 96 96 Effective workload on A (minutes/day) 600 480 960 Effective workload on B (minutes/day) 432 432 Effective workload on C(minutes/day) 384 768 Total effective workload (minutes/day) 744 1440 432 1248 22556 Effective IU (%, 2 decimals) 34.44% 100.00% 22.50% 74.29% 78.33% Utilization (%, 2 decimals) 34.44% 100.00% 22.50% 74.29% 78.33% 0 600 540 0 480 930 96 96 96 10 360 360 0 480 10 1864 Note: if a worker works in multiple resources, the worker distributes his/her work time on those resources. In that case, the worker counts for the resources can be decimal numbers. On the supply side, we know how many workers are in charge of each resource and the processing time in minutes per unit for each product at each resource. Zero processing time means the product of interest does not go through the corresponding resource at all. Besides, assume that inputs are always sufficient. On the demand side, we know demands for products A, B, and C per day as follows: demand for A is 150 units per day; demand for B is 90 units per day; and demand for C is 120 units per day. We assume a fixed product mix of A:B:C = 5:3:4. (a)[2] Draw a process flow diagram of the process, assuming that there are buffers between resources. Make sure to have process boundaries. (b)[1] Find two measures of capacity for each resource as in the table. (c)[1] Find total workload on each resource. (d)[1] Find implied utilizations of individual resources. Draw the implied utilization profile. (e)[1] Find the bottleneck and the demand-acceptance ratio (if IU[BN] > 1 then DAR = 1/1U[BN]). (f)[1] Based on the demand acceptance ratio, find the effective flow rates of A, B, and C. Explain. (g)[1] Find total effective workload and effective IV on each resource. (h)[1] Find utilizations of individual resources. Draw the utilization profile. O[1] Process analysis is for designing and improving business processes! By looking at the implied utilization and utilization profiles, propose one way to reallocate workers among the resources so as to increase the flow rates of products A, B, and C. For this part, you should try to implement the table in Excel and reallocate workers in your Excel templateStep by Step Solution
There are 3 Steps involved in it
1 Expert Approved Answer
Step: 1 Unlock

Question Has Been Solved by an Expert!
Get step-by-step solutions from verified subject matter experts
Step: 2 Unlock
Step: 3 Unlock