

Question: A thru G, steps in excel preferred. Question 1. Use the following data to answer the following questions. a) Determine the mean, standard deviation, and
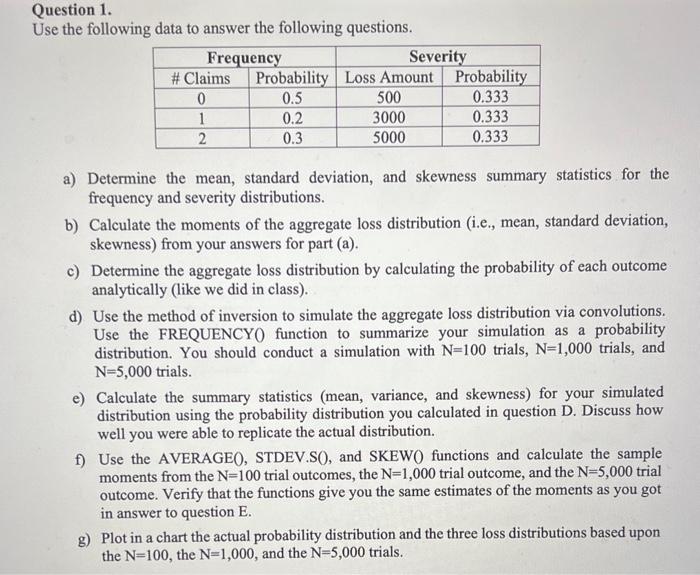
Question 1. Use the following data to answer the following questions. a) Determine the mean, standard deviation, and skewness summary statistics for the frequency and severity distributions. b) Calculate the moments of the aggregate loss distribution (i.e., mean, standard deviation, skewness) from your answers for part (a). c) Determine the aggregate loss distribution by calculating the probability of each outcome analytically (like we did in class). d) Use the method of inversion to simulate the aggregate loss distribution via convolutions. Use the FREQUENCYO function to summarize your simulation as a probability distribution. You should conduct a simulation with N=100 trials, N=1,000 trials, and N=5,000 trials. e) Calculate the summary statistics (mean, variance, and skewness) for your simulated distribution using the probability distribution you calculated in question D. Discuss how well you were able to replicate the actual distribution. f) Use the AVERAGEO, STDEV.S(), and SKEWO functions and calculate the sample moments from the N=100 trial outcomes, the N=1,000 trial outcome, and the N=5,000 trial outcome. Verify that the functions give you the same estimates of the moments as you got in answer to question E. g) Plot in a chart the actual probability distribution and the three loss distributions based upon the N=100, the N=1,000, and the N=5,000 trials
Step by Step Solution
There are 3 Steps involved in it

Get step-by-step solutions from verified subject matter experts