

Question: Discuss your evaluation of WINTER ENERGY BILL graph or chart you find particularly interesting, effective, misleading, or difficult to understand. In your discussion, focus on
Discuss your evaluation of WINTER ENERGY BILL graph or chart you find particularly interesting, effective, misleading, or difficult to understand. In your discussion, focus on answering some of the following questions:
Does the graph represent the data accurately?
Does the graph meet best-practice criteria?
Does the graph speak to the target audience?
Is the graph in any way misleading, intentionally or unintentionally?
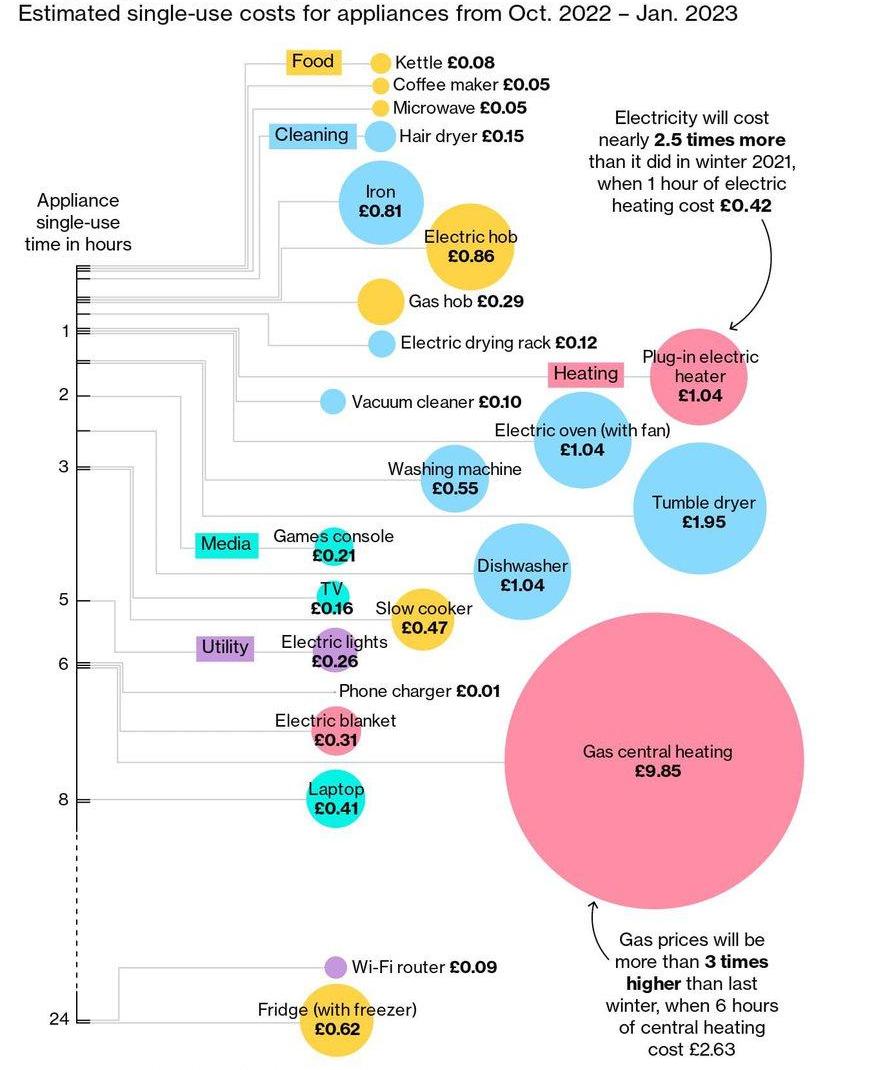
Estimated single-use costs for appliances from Oct. 2022 - Jan. 2023 Appliance single-use time in hours 1 E 2 3 5 6 = 24 = Media Utility Food Cleaning Iron 0.81 Kettle 0.08 Coffee maker 0.05 Microwave 0.05 Hair dryer 0.15 Electric lights 0.26 Vacuum cleaner 0.10 Electric hob 0.86 Gas hob 0.29 Laptop 0.41 Games console 0.21 TV 0.16 Slow cooker 0.47 Electric blanket 0.31 Electric drying rack 0.12 Washing machine 0.55 Phone charger 0.01 Fridge (with freezer) 0.62 Electricity will cost nearly 2.5 times more than it did in winter 2021, when 1 hour of electric heating cost 0.42 Electric oven (with fan) 1.04 Dishwasher 1.04 Wi-Fi router 0.09 Heating Plug-in electric heater 1.04 Tumble dryer 1.95 Gas central heating 9.85 Gas prices will be more than 3 times higher than last winter, when 6 hours of central heating cost 2.63
Step by Step Solution
3.42 Rating (174 Votes )
There are 3 Steps involved in it
The data for the graph is accurate it shows how much money its going to co... View full answer

Get step-by-step solutions from verified subject matter experts