

Question: ( a ) Use a statistical package to find the value of the linear correlation coefficient between year and NYC temp. (b) Is the correlation

( a ) Use a statistical package to find the value of the linear correlation coefficient between "year" and NYC temp.
(b) Is the correlation significant? Explain the reason for your answer
(c) If the correlation is significant, what does it imply about the trend in temperatures?
(d) Find the equation for the least squares regression (LSR) line
(e) Interpret the meaning of the slope of the LSR line.
(f) Based on the equation of LSR line, what is the "best predicted" value for the NYC Annual Average Temperature for 2013? How accurate is the prediction?
(g) Can we use this LSR line equation to predict the Annual Average Temperatures for the future? Explain.
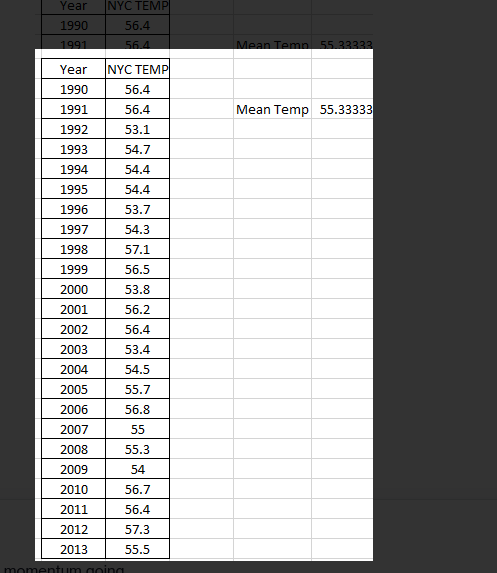
Year NYC TEMP 1990 56.4 1991 564 Mean 55 32323 Year NYC TEMP 1990 56.4 1991 56.4 Mean Temp 55.33333 1992 53.1 1993 54.7 1994 54.4 1995 54.4 1996 53.7 1997 54.3 1998 57.1 1999 56.5 2000 53.8 2001 56.2 2002 56.4 2003 53.4 2004 54.5 2005 55.7 2006 56.8 2007 55 2008 55.3 2009 54 2010 56.7 2011 56.4 2012 57.3 2013 55.5
Step by Step Solution
There are 3 Steps involved in it

Get step-by-step solutions from verified subject matter experts