

Question: fConsider the original program that estimates oyster volume using 2D digital image processing. 1. Create a scatterplot of 2D volume reconstruction and actual volume, using
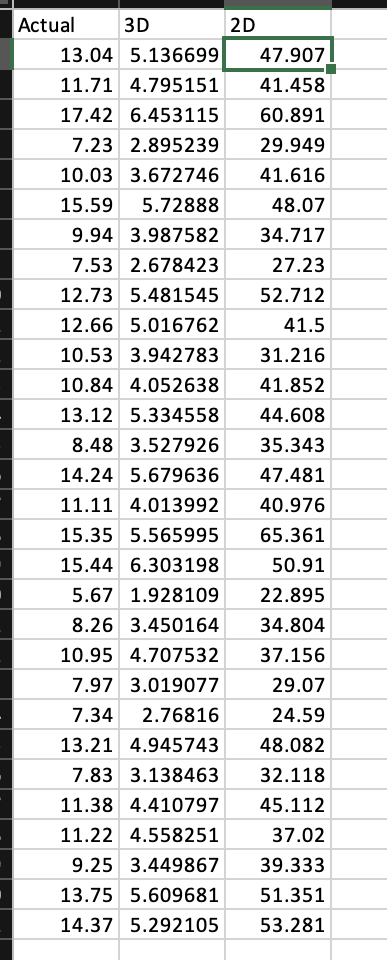


\fConsider the original program that estimates oyster volume using 2D digital image processing. 1. Create a scatterplot of 2D volume reconstruction and actual volume, using 2D reconstruction for the explanatory variable. Find the equation for the least-squares regression line. 2. Verify the conditions for inference. 3. Test whether the linear relationship is statistically significant and give a 95% confidence interval for the slope of the population regression line. Now consider the newer program that estimates oyster volume using 3D digital image processing. 1. Create a scatterplot of 3D volume reconstruction and actual volume, using 3D reconstruction for the explanatory variable. Find the equation for the least-squares regression line. 2. Verify the conditions for inference. 3. Test whether the linear relationship is statistically significant and give a 95% confidence interval for the slope of the population regression line. In yourjudgment, is the 3D imaging system practically useful? How does it compare with the 2D program
Step by Step Solution
There are 3 Steps involved in it

Get step-by-step solutions from verified subject matter experts