

Question: (a) Use command ScatterPlot to make a scatter diagram. Comment on the type of relation that may exist between the two variables. (b) Find the
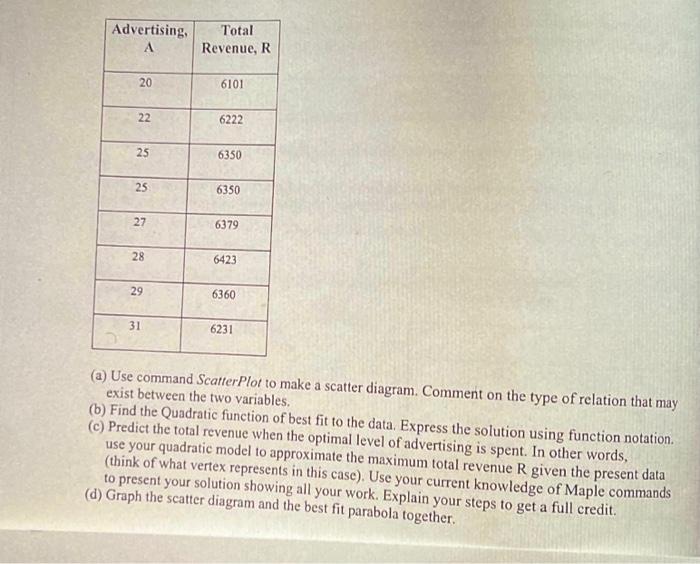
(a) Use command ScatterPlot to make a scatter diagram. Comment on the type of relation that may exist between the two variables. (b) Find the Quadratic function of best fit to the data. Express the solution using function notation. (c) Predict the total revenue when the optimal level of advertising is spent. In other words, use your quadratic model to approximate the maximum total revenue R given the present data (think of what vertex represents in this case). Use your current knowledge of Maple commands to present your solution showing all your work. Explain your steps to get a full credit. (d) Graph the scatter diagram and the best fit parabola together
Step by Step Solution
There are 3 Steps involved in it

Get step-by-step solutions from verified subject matter experts