

Question: (a) Use the annual maximum wind speed data to construct a histogram. Whether the data is discrete or continuous affects how we structure our histogram.
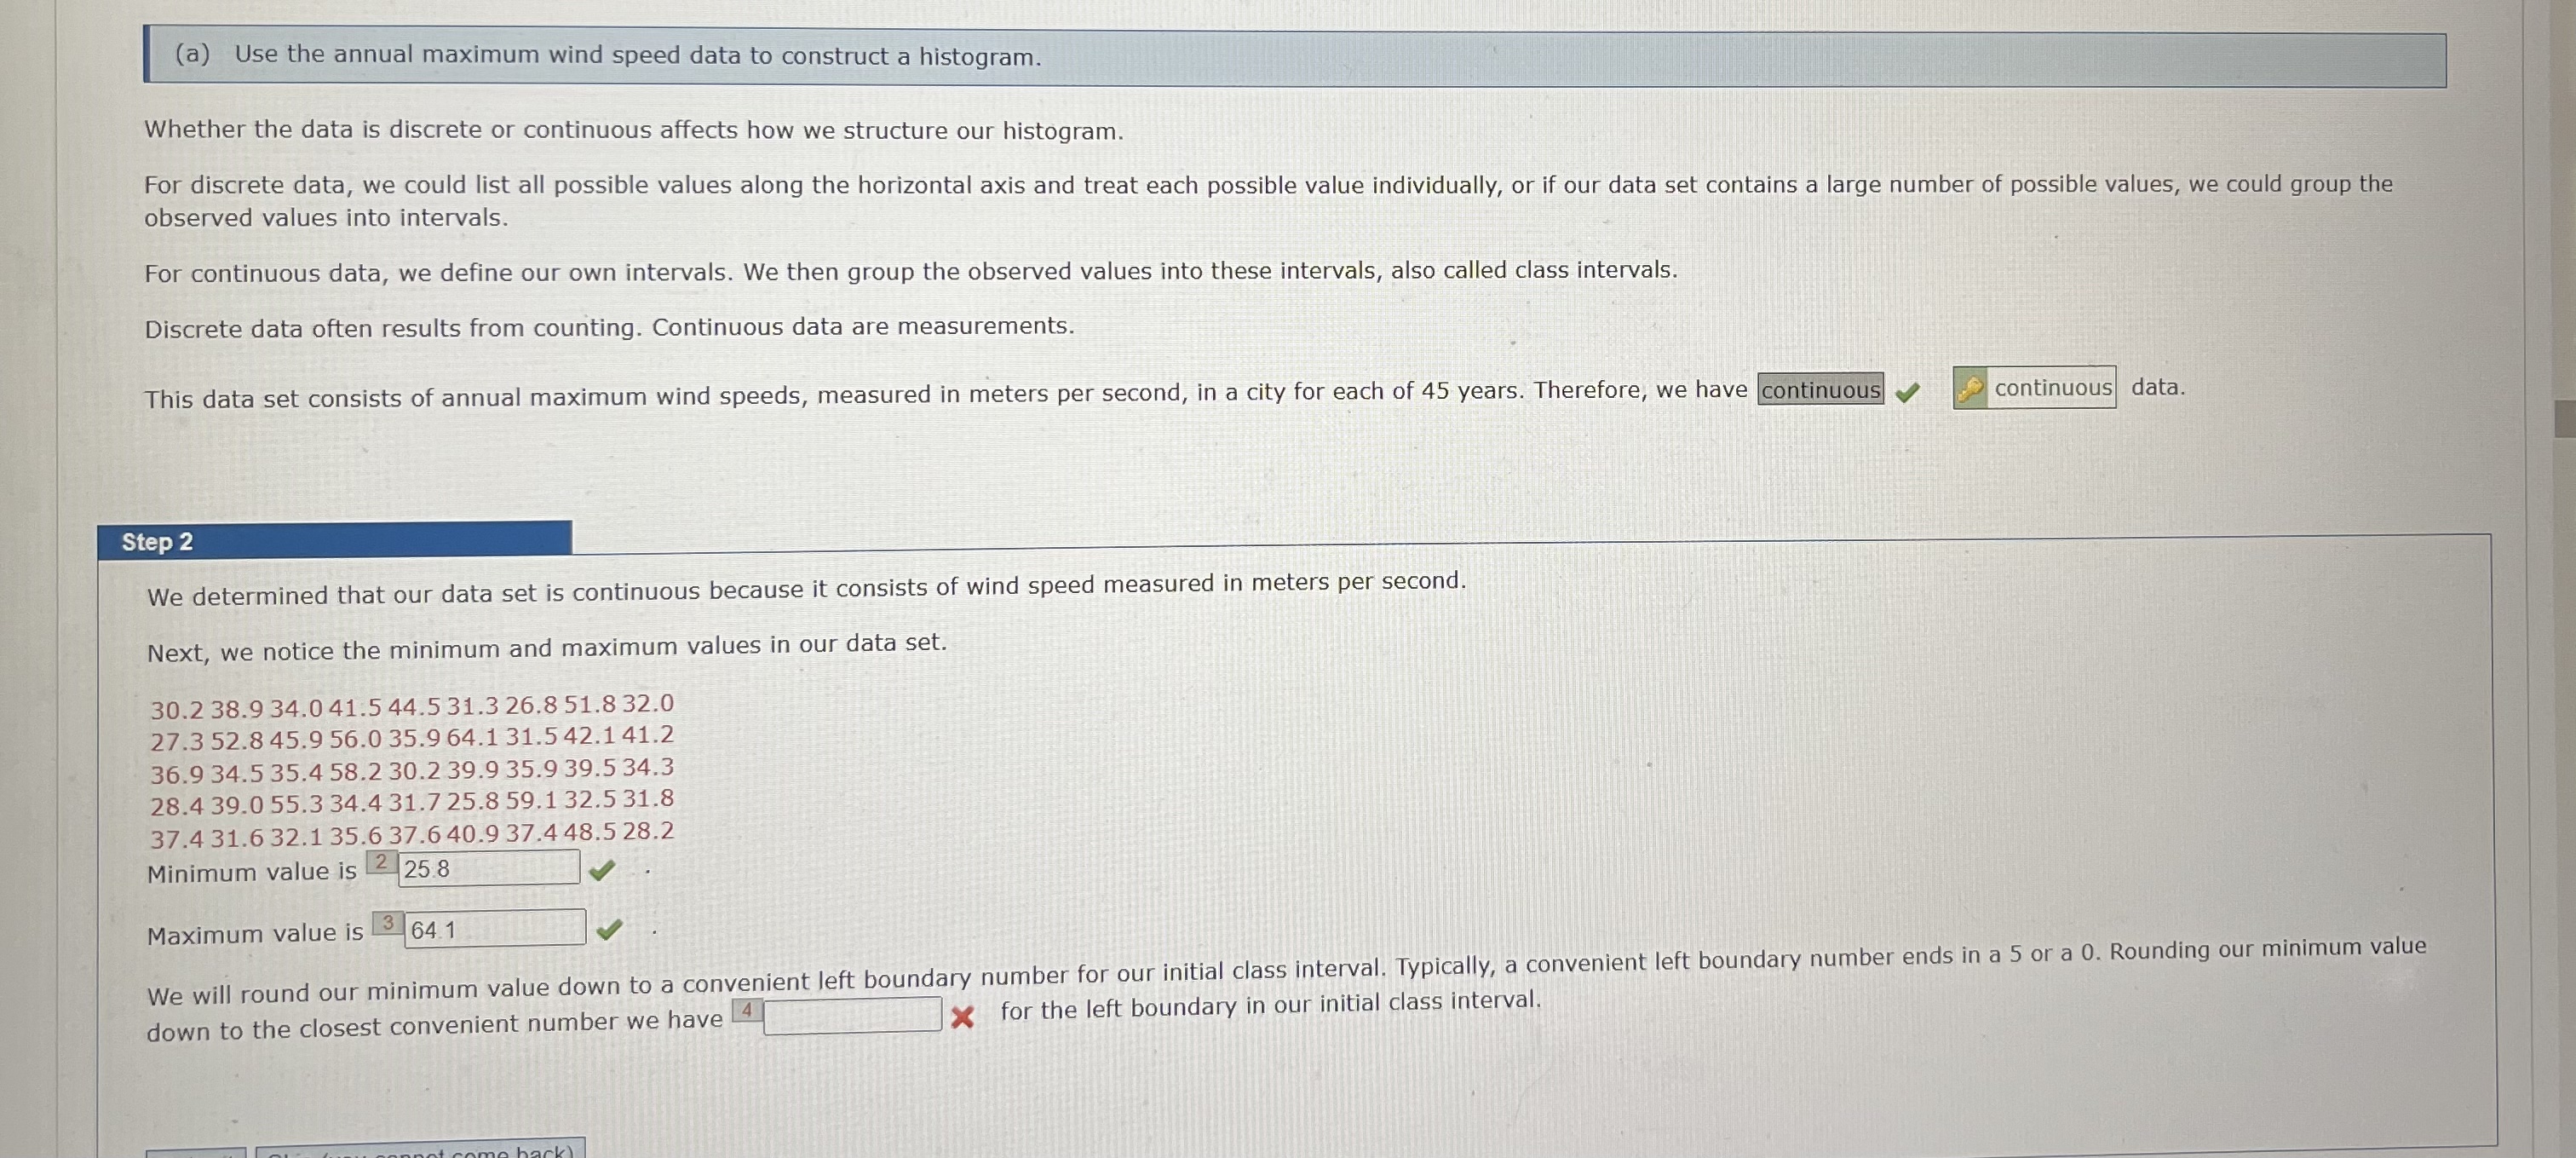
(a) Use the annual maximum wind speed data to construct a histogram. Whether the data is discrete or continuous affects how we structure our histogram. For discrete data, we could list all possible values along the horizontal axis and treat each possible value individually, or if our data set contains a large number of possible values, we could group the observed values into intervals. For continuous data, we define our own intervals. We then group the observed values into these intervals, also called class intervals. Discrete data often results from counting. Continuous data are measurements. This data set consists of annual maximum wind speeds, measured in meters per second, in a city for each of 45 years. Therefore, we have continuous continuous data. Step 2 We determined that our data set is continuous because it consists of wind speed measured in meters per second. Next, we notice the minimum and maximum values in our data set. 30.2 38.9 34.0 41.5 44.5 31.3 26.8 51.8 32.0 27.3 52.8 45.9 56.0 35.9 64.1 31.5 42.1 41.2 36.9 34.5 35.4 58.2 30.2 39.9 35.9 39.5 34.3 28.4 39.0 55.3 34.4 31.7 25.8 59.1 32.5 31.8 37.4 31.6 32.1 35.6 37.6 40.9 37.4 48.5 28.2 Minimum value is 2 25.8 Maximum value is 3 64.1 We will round our minimum value down to a convenient left boundary number for our initial class interval. Typically, a convenient left boundary number ends in a 5 or a 0. Rounding our minimum value down to the closest convenient number we have x for the left boundary in our initial class interval
Step by Step Solution
There are 3 Steps involved in it

Get step-by-step solutions from verified subject matter experts