

Question: Que The accompanying data on annual maximum wind speed (in meters per second) in a city for each year in a 45-year period were given
Que The accompanying data on annual maximum wind speed (in meters per second) in a city for each year in a 45-year period were given
30.2, 38.9, 34.0, 38.5, 44.7, 31.5, 26.6, 51.8, 31.8, 27.3, 53.0, 45.7, 63.4, 36.1, 63.9,31.3, 42.3, 41.0, 37.1, 34.5, 35.6, 62.3, 30.4, 40.1, 35.9, 39.5, 34.3, 28.2, 39.0, 55.1,35.1, 28.7, 25.6, 62.6, 32.3, 32.0, 37.4, 31.4, 32.1, 35.4, 37.4, 41.1, 37.4, 48.7, 28.2
Part (a) Use the annual maximum wind speed data to construct a histogram.
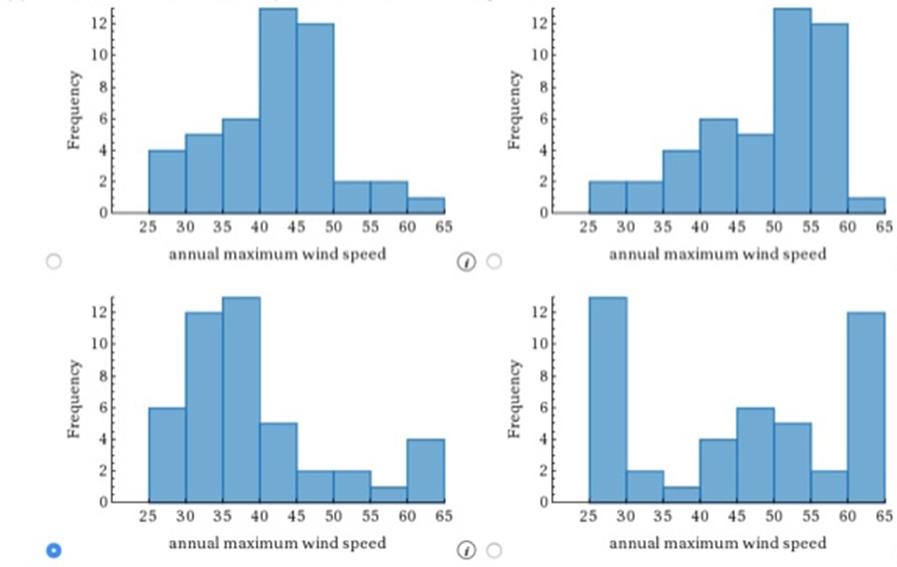
Part (b) Is the histogram approximately symmetric, positive skewed, or negatively skewed?
(A) The distribution of maximum wind speeds is positively skewed.
(B) The distribution of maximum wind speeds is negatively skewed.
(C) The distribution of maximum wind speeds is approximately symmetric.
Part (c) Would you describe the histogram as unimodal, bimodal, or multimodal?
(A) The distribution is multimodal, with at peaks at the 25-30, 45-50 and 60-65.
(B) The distribution is bimodal, with peaks at the 35-40 and 60-65 intervals.
(C) The distribution is unimodal, with a peak at the 35-40.
(D) The distribution of bimodal, with peaks at the 40-45 and 50-60 intervals.
12 10 222 Frequency 12 10 Frequency 8642 25 30 35 40 45 50 55 60 65 annual maximum wind speed 25 30 35 40 45 50 55 60 65 annual maximum wind speed 12 10 20% Frequency 6 2 10 864 Frequency 25 30 35 40 45 50 55 60 65 annual maximum wind speed 2 25 30 35 40 45 50 55 60 65 annual maximum wind speed
Step by Step Solution
There are 3 Steps involved in it
Solution Given data 302 389 340 385 447 315 266 518 318 273 530 457 634 361 639 313 423 410 371 345 ... View full answer

Get step-by-step solutions from verified subject matter experts