

Question: a. Use the applicable tables to complete the missing information for each attribute. b. For which attributes are the sample results unacceptable? c. Compare attributes
a. Use the applicable tables to complete the missing information for each attribute.
b. For which attributes are the sample results unacceptable?
c. Compare attributes 1 and 3. Why does attribute 1 have the smaller sample size?
d. Compare attributes 2 and 5. Why is CUER higher for attribute 5?
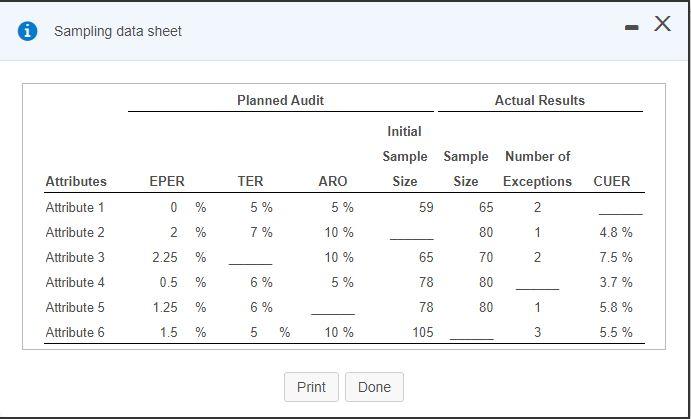
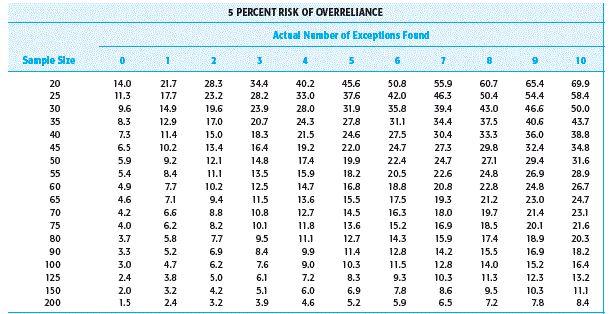
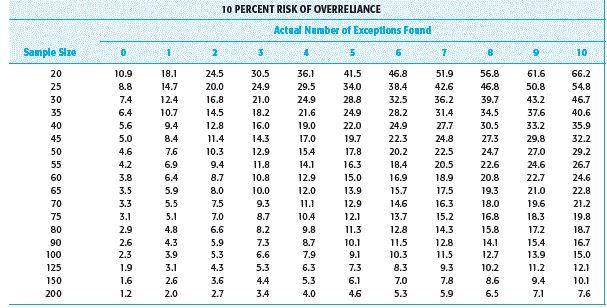
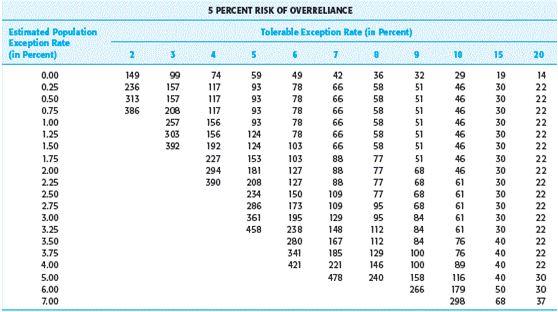
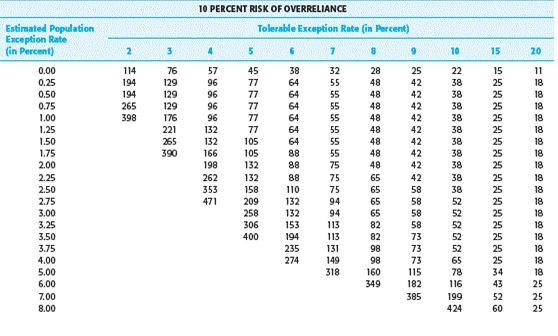
0 Sampling data sheet X Planned Audit Actual Results Initial EPER TER ARO Sample Sample Number of Size Exceptions 59 65 2 Size CUER 0 % 5 % 5% 2 % 7% 10 % 80 1 4.8 % Attributes Attribute 1 Attribute 2 Attribute 3 Attribute 4 Attribute 5 Attribute 6 2.25 % 70 2 7.5 % 10 % 5% % 6% 80 3.7 % 0.5 1.25 65 78 78 105 % 6% 80 1 1 3 5.8 % 5.5 % 1.5 % 6 5 % 10 % 3 Print Done 5 PERCENT RISK OF OVERRELIANCE Actual Neraber of Exceptions Found Sample Size 0 1 2 3 5 6 7 8 9 10 28.3 23.2 19.6 17.0 15.0 13.4 12.1 20 25 30 35 40 45 50 55 60 65 70 75 80 90 100 125 150 200 55.9 46.3 39.4 34.4 30.4 27.3 24.7 22.6 20.8 14.0 11.3 9.6 8.3 7.3 6.5 5.9 5.4 4.9 4.6 4.2 4.0 3.7 3.3 3.0 2.4 2.0 1.5 21.7 17.7 14.9 12.9 11.4 10.2. 9.2 8.4 7.7 7.1 6.6 6.2 5.8 5.2 4.7 3.8 3.2 2.4 34.4 28.2 23.9 20.7 18.3 16.4 14.8 13.5 12.5 11.5 10.8 10.1 9.5 8.4 7.6 6.1 5.1 3.9 40.2 33.0 28.0 24.3 21.5 19.2 17.4 15.9 14.7 13.6 12.7 11.8 11.1 9.9 9.0 7.2 6.0 4.6 50.8 42.0 35.8 31.1 27.5 24.7 22.4 20.5 18.8 17.5 45.6 37.6 31.9 27.8 24.6 22.0 19.9 18.2 16.8 15.5 14.5 13.6 12.7 11.4 10.3 8.3 6.9 5.2 10.2 9.4 8.8 8.2 7.7 6.9 6.2 5.0 4.2 3.2 60.7 50.4 43.0 37.5 33.3 29.8 27.1 24.8 22.8 21.2 19.7 18.5 17.4 15.5 14.0 11.3 9.5 7.2 65.4 54.4 46.6 40.6 36.0 32.4 29.4 26.9 24.8 23.0 21.4 20.1 18.9 16.9 15.2 12.3 10.3 7.8 69.9 58.4 50.0 43.7 38.8 34.8 31.6 28.9 26.7 24.7 23.1 21.6 20.3 18.2 16.4 13.2 19.3 16.3 15.2 14.3 12.8 11.5 9.3 7.8 5.9 18.0 16.9 15.9 14.2 12.8 10.3 8.6 6.5 8.4 10 PERCENT RISK OF OVERRELIANCE Actual Nurnber of Exceptions Found Sample Size 2 3 5 6 7 8 10 10.9 8.8 7.4 6.4 5.6 5.0 4.6 20 25 30 35 40 45 50 55 60 65 70 75 80 90 100 125 150 200 4.2 18.1 14.7 12.4 10.7 9.4 8.4 7.6 6.9 6.4 5.9 5.5 5.1 4.8 4.3 3.9 3.1 2.6 2.0 3.8 3.5 3.3 3.1 2.9 24.5 20.0 16.8 14.5 12.8 11.4 10.3 9.4 8.7 8.0 7.5 7.0 6.6 5.9 5.3 4.3 3.6 2.7 30.5 24.9 21.0 18.2 16.0 14.3 12.9 11.8 10.8 10.0 9.3 8.7 8.2 7.3 6.6 5.3 4.4 3.4 36.1 29.5 24.9 21.6 19.0 17.0 15.4 14.1 12.9 12.0 11.1 10.4 9.8 8.7 7.9 6.3 5.3 4.0 41.5 34.0 28.8 24.9 22.0 19.7 17.8 16.3 15.0 13.9 12.9 12.1 11.3 10.1 9.1 7.3 6.1 4.6 46.8 38.4 32.5 28.2 24.9 22.3 20.2 18.4 16.9 15.7 14.6 13.7 12.8 11.5 10.3 8.3 7.0 5.3 51.9 42.6 36.2 31.4 27.7 24.8 22.5 20.5 18.9 17.5 16.3 15.2 14.3 12.8 11.5 9.3 7.8 5.9 56.8 46.8 39.7 34.5 30.5 27.3 24.7 22.6 20.8 19.3 18.0 16.8 15.8 14.1 12.7 10.2 8.6 6.5 66.2 54.8 46.7 40.6 35.9 32.2 29.2 26.7 24.6 22.8 21.2 19.8 18.7 61.6 50.8 43.2 37.6 33.2 29.8 27.0 24.6 22.7 21.0 19.6 18.3 17.2 15.4 13.9 11.2 9.4 7.1 2.6 16.7 2.3 1.9 1.6 1.2 15.0 12.1 10.1 7.6 5 PERCENT RISK OF OVERRELIANCE Tolerable Exception Rate (in Percent) Estimated Population Exception Rate in Percent) 2 5 15 20 42 149 236 386 157 157 20 19 30 6 3 51 || || 51 51 | 74 117 117 117 156 156 192 227 294 390 36 32 6 0.00 025 0.50 0.75 100 1.25 1.50 175 200 2.25 2.50 2.75 3.00 3.25 3.50 3.75 4.00 5.00 6.00 7:00 59 97 5 93 3 124 14 153 18] 20 24 296 ) 458 49 TB 18 TB 78 78 10 103 127 127 150 173 195 238 280 341 421 8 109 109 29 18 167 16 221 47 %%%%%%%nDnDSBN 68 68 68 EB 4 4 4 100 | 100 158 266 nanan 112 112 129 146 40 14 22 22 22 22 22 22 22 22 22 22 22 22 22 22 22 22 30 30 30 42 40 40 40 0 69 179 298 TO PERCENT RISK OF OVERRELIANCE Tolerable Exception Rate (in Percent) Estimated Population Exception Rate (in Percent) 2 3 4 5 6 7 8 9 10 15 20 114 194 194 265 398 47777 57 96 96 96 96 132 132 166 198 262 353 471 42 42 42 42 42 42 176 221 265 390 0.00 0.25 0.50 0.75 1.00 1.25 1.50 1.75 2.00 2.25 2.50 2.75 3.00 3.25 3.50 3.75 4,00 5.00 6.00 7.00 8.00 22 38 38 38 38 38 38 32 55 55 55 55 55 55 55 75 75 75 94 94 77 105 105 132 132 158 209 258 306 400 38 64 64 64 64 64 64 BB 88 88 110 132 132 153 194 235 274 28 48 48 48 48 48 48 48 48 65 65 65 65 82 82 98 98 160 349 11 18 18 18 18 18 18 18 18 19 18 18 18 18 18 38 38 38 42 42 58 58 58 58 73 52 18 73 115 182 385 65 78 116 199 424 0 Sampling data sheet X Planned Audit Actual Results Initial EPER TER ARO Sample Sample Number of Size Exceptions 59 65 2 Size CUER 0 % 5 % 5% 2 % 7% 10 % 80 1 4.8 % Attributes Attribute 1 Attribute 2 Attribute 3 Attribute 4 Attribute 5 Attribute 6 2.25 % 70 2 7.5 % 10 % 5% % 6% 80 3.7 % 0.5 1.25 65 78 78 105 % 6% 80 1 1 3 5.8 % 5.5 % 1.5 % 6 5 % 10 % 3 Print Done 5 PERCENT RISK OF OVERRELIANCE Actual Neraber of Exceptions Found Sample Size 0 1 2 3 5 6 7 8 9 10 28.3 23.2 19.6 17.0 15.0 13.4 12.1 20 25 30 35 40 45 50 55 60 65 70 75 80 90 100 125 150 200 55.9 46.3 39.4 34.4 30.4 27.3 24.7 22.6 20.8 14.0 11.3 9.6 8.3 7.3 6.5 5.9 5.4 4.9 4.6 4.2 4.0 3.7 3.3 3.0 2.4 2.0 1.5 21.7 17.7 14.9 12.9 11.4 10.2. 9.2 8.4 7.7 7.1 6.6 6.2 5.8 5.2 4.7 3.8 3.2 2.4 34.4 28.2 23.9 20.7 18.3 16.4 14.8 13.5 12.5 11.5 10.8 10.1 9.5 8.4 7.6 6.1 5.1 3.9 40.2 33.0 28.0 24.3 21.5 19.2 17.4 15.9 14.7 13.6 12.7 11.8 11.1 9.9 9.0 7.2 6.0 4.6 50.8 42.0 35.8 31.1 27.5 24.7 22.4 20.5 18.8 17.5 45.6 37.6 31.9 27.8 24.6 22.0 19.9 18.2 16.8 15.5 14.5 13.6 12.7 11.4 10.3 8.3 6.9 5.2 10.2 9.4 8.8 8.2 7.7 6.9 6.2 5.0 4.2 3.2 60.7 50.4 43.0 37.5 33.3 29.8 27.1 24.8 22.8 21.2 19.7 18.5 17.4 15.5 14.0 11.3 9.5 7.2 65.4 54.4 46.6 40.6 36.0 32.4 29.4 26.9 24.8 23.0 21.4 20.1 18.9 16.9 15.2 12.3 10.3 7.8 69.9 58.4 50.0 43.7 38.8 34.8 31.6 28.9 26.7 24.7 23.1 21.6 20.3 18.2 16.4 13.2 19.3 16.3 15.2 14.3 12.8 11.5 9.3 7.8 5.9 18.0 16.9 15.9 14.2 12.8 10.3 8.6 6.5 8.4 10 PERCENT RISK OF OVERRELIANCE Actual Nurnber of Exceptions Found Sample Size 2 3 5 6 7 8 10 10.9 8.8 7.4 6.4 5.6 5.0 4.6 20 25 30 35 40 45 50 55 60 65 70 75 80 90 100 125 150 200 4.2 18.1 14.7 12.4 10.7 9.4 8.4 7.6 6.9 6.4 5.9 5.5 5.1 4.8 4.3 3.9 3.1 2.6 2.0 3.8 3.5 3.3 3.1 2.9 24.5 20.0 16.8 14.5 12.8 11.4 10.3 9.4 8.7 8.0 7.5 7.0 6.6 5.9 5.3 4.3 3.6 2.7 30.5 24.9 21.0 18.2 16.0 14.3 12.9 11.8 10.8 10.0 9.3 8.7 8.2 7.3 6.6 5.3 4.4 3.4 36.1 29.5 24.9 21.6 19.0 17.0 15.4 14.1 12.9 12.0 11.1 10.4 9.8 8.7 7.9 6.3 5.3 4.0 41.5 34.0 28.8 24.9 22.0 19.7 17.8 16.3 15.0 13.9 12.9 12.1 11.3 10.1 9.1 7.3 6.1 4.6 46.8 38.4 32.5 28.2 24.9 22.3 20.2 18.4 16.9 15.7 14.6 13.7 12.8 11.5 10.3 8.3 7.0 5.3 51.9 42.6 36.2 31.4 27.7 24.8 22.5 20.5 18.9 17.5 16.3 15.2 14.3 12.8 11.5 9.3 7.8 5.9 56.8 46.8 39.7 34.5 30.5 27.3 24.7 22.6 20.8 19.3 18.0 16.8 15.8 14.1 12.7 10.2 8.6 6.5 66.2 54.8 46.7 40.6 35.9 32.2 29.2 26.7 24.6 22.8 21.2 19.8 18.7 61.6 50.8 43.2 37.6 33.2 29.8 27.0 24.6 22.7 21.0 19.6 18.3 17.2 15.4 13.9 11.2 9.4 7.1 2.6 16.7 2.3 1.9 1.6 1.2 15.0 12.1 10.1 7.6 5 PERCENT RISK OF OVERRELIANCE Tolerable Exception Rate (in Percent) Estimated Population Exception Rate in Percent) 2 5 15 20 42 149 236 386 157 157 20 19 30 6 3 51 || || 51 51 | 74 117 117 117 156 156 192 227 294 390 36 32 6 0.00 025 0.50 0.75 100 1.25 1.50 175 200 2.25 2.50 2.75 3.00 3.25 3.50 3.75 4.00 5.00 6.00 7:00 59 97 5 93 3 124 14 153 18] 20 24 296 ) 458 49 TB 18 TB 78 78 10 103 127 127 150 173 195 238 280 341 421 8 109 109 29 18 167 16 221 47 %%%%%%%nDnDSBN 68 68 68 EB 4 4 4 100 | 100 158 266 nanan 112 112 129 146 40 14 22 22 22 22 22 22 22 22 22 22 22 22 22 22 22 22 30 30 30 42 40 40 40 0 69 179 298 TO PERCENT RISK OF OVERRELIANCE Tolerable Exception Rate (in Percent) Estimated Population Exception Rate (in Percent) 2 3 4 5 6 7 8 9 10 15 20 114 194 194 265 398 47777 57 96 96 96 96 132 132 166 198 262 353 471 42 42 42 42 42 42 176 221 265 390 0.00 0.25 0.50 0.75 1.00 1.25 1.50 1.75 2.00 2.25 2.50 2.75 3.00 3.25 3.50 3.75 4,00 5.00 6.00 7.00 8.00 22 38 38 38 38 38 38 32 55 55 55 55 55 55 55 75 75 75 94 94 77 105 105 132 132 158 209 258 306 400 38 64 64 64 64 64 64 BB 88 88 110 132 132 153 194 235 274 28 48 48 48 48 48 48 48 48 65 65 65 65 82 82 98 98 160 349 11 18 18 18 18 18 18 18 18 19 18 18 18 18 18 38 38 38 42 42 58 58 58 58 73 52 18 73 115 182 385 65 78 116 199 424
Step by Step Solution
There are 3 Steps involved in it

Get step-by-step solutions from verified subject matter experts