

Question: The sampling data sheet below is missing selected information for six attributes involving tests of transactions for the sales and collection cycle. (Click the icon
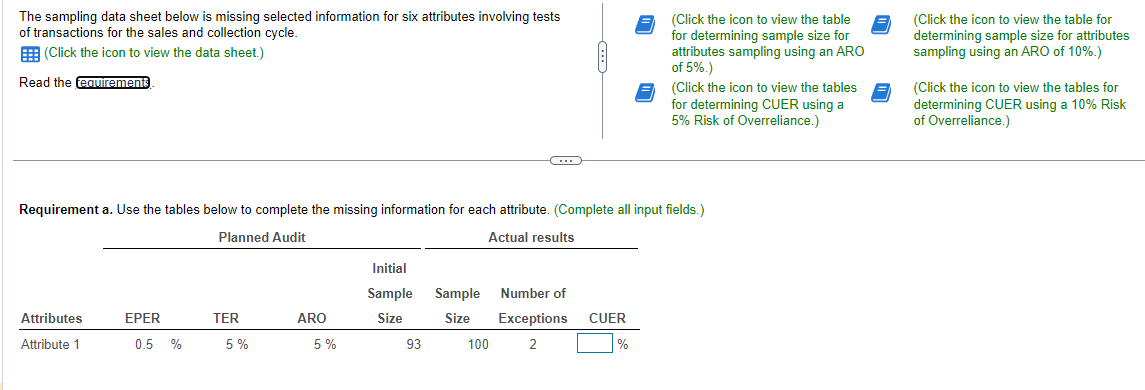
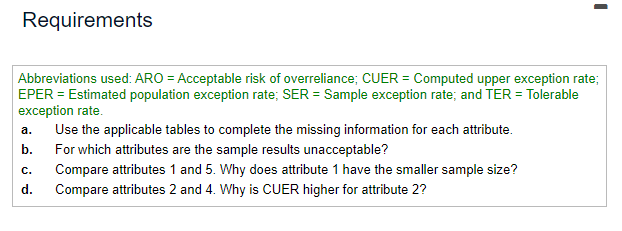
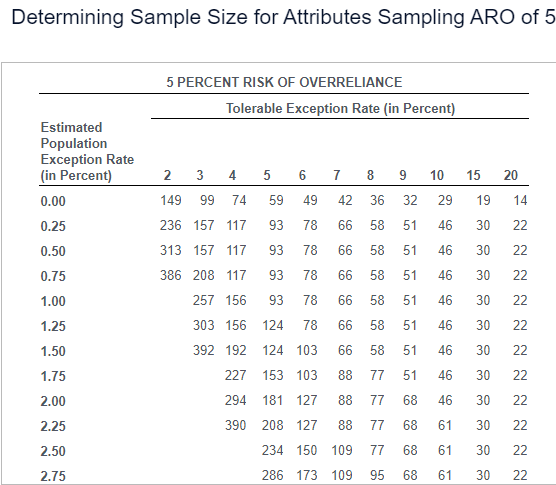
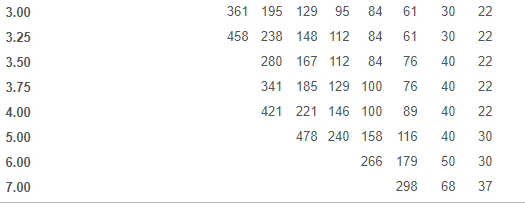
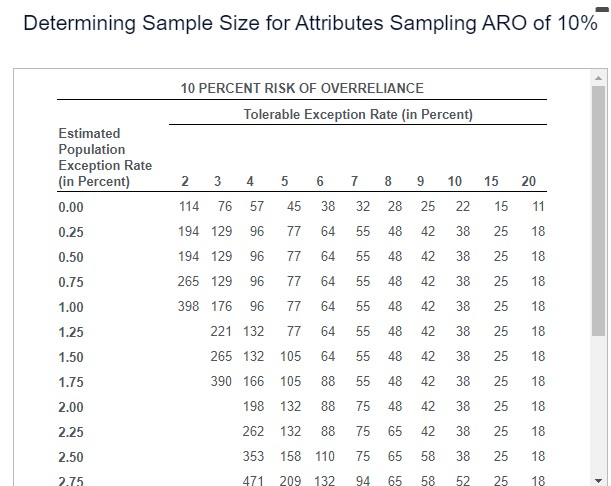
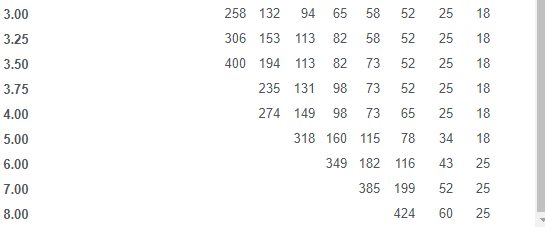
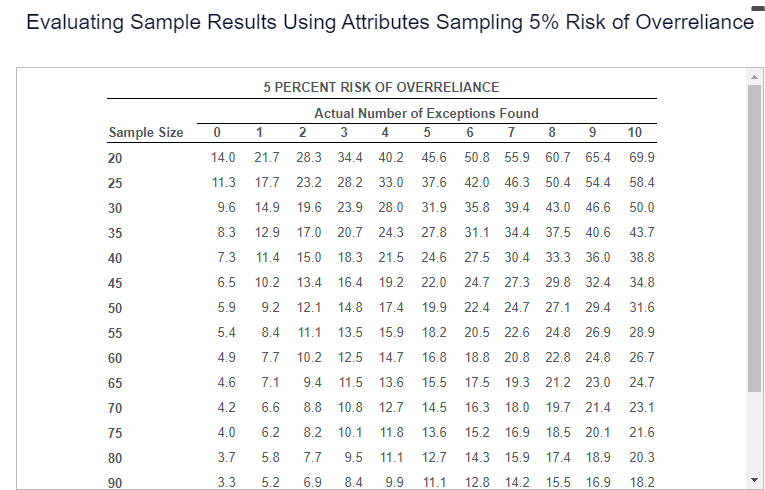
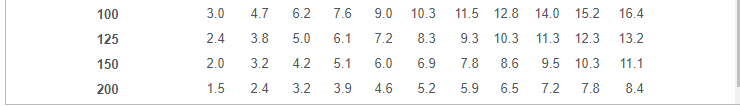
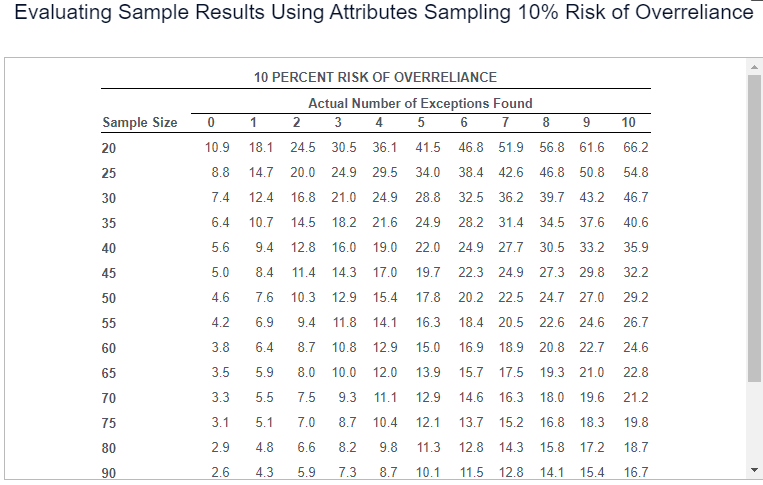
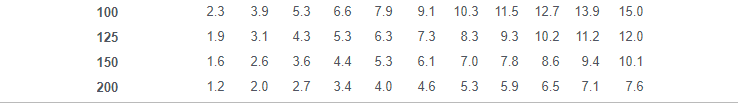
The sampling data sheet below is missing selected information for six attributes involving tests of transactions for the sales and collection cycle. (Click the icon to view the data sheet.) Read the Requirement a. Use the tables below to complete the missing information for each attribute. (Complete all input fields.) Abbreviations used: ARO = Acceptable risk of overreliance; CUER = Computed upper exception rate; EPER = Estimated population exception rate; SER = Sample exception rate; and TER = Tolerable exception rate. a. Use the applicable tables to complete the missing information for each attribute. b. For which attributes are the sample results unacceptable? c. Compare attributes 1 and 5 . Why does attribute 1 have the smaller sample size? d. Compare attributes 2 and 4 . Why is CUER higher for attribute 2 ? Determining Sample Size for Attributes Sampling ARO of 3.003.253.503.754.005.006.007.0036145834142119523828018522112914816712914647895112112100100240848484768915826661617640401161792983030402222405068222222303037 Determining Sample Size for Attributes Sampling ARO of 10% 3.003.253.503.754.005.006.007.008.002583064002741321531942351499411311313198318658282987316034958587373651151823855252525225781161994242525252518344352601818181818252525 Evaluating Sample Results Using Attributes Sampling 5% Risk of Overreliance 1001251502003.02.42.01.54.73.83.22.46.25.04.23.27.66.15.13.99.07.26.04.610.38.36.95.211.59.37.85.912.810.38.66.514.011.39.57.215.212.310.37.816.413.211.18.4 Evaluating Sample Results Using Attributes Sampling 10% Risk of Overreliance 1001251502002.31.91.61.23.93.12.62.05.34.33.62.76.65.34.43.47.96.35.34.09.17.36.14.610.38.37.05.311.59.37.85.912.710.28.66.513.911.29.47.115.012.010.17.6 The sampling data sheet below is missing selected information for six attributes involving tests of transactions for the sales and collection cycle. (Click the icon to view the data sheet.) Read the Requirement a. Use the tables below to complete the missing information for each attribute. (Complete all input fields.) Abbreviations used: ARO = Acceptable risk of overreliance; CUER = Computed upper exception rate; EPER = Estimated population exception rate; SER = Sample exception rate; and TER = Tolerable exception rate. a. Use the applicable tables to complete the missing information for each attribute. b. For which attributes are the sample results unacceptable? c. Compare attributes 1 and 5 . Why does attribute 1 have the smaller sample size? d. Compare attributes 2 and 4 . Why is CUER higher for attribute 2 ? Determining Sample Size for Attributes Sampling ARO of 3.003.253.503.754.005.006.007.0036145834142119523828018522112914816712914647895112112100100240848484768915826661617640401161792983030402222405068222222303037 Determining Sample Size for Attributes Sampling ARO of 10% 3.003.253.503.754.005.006.007.008.002583064002741321531942351499411311313198318658282987316034958587373651151823855252525225781161994242525252518344352601818181818252525 Evaluating Sample Results Using Attributes Sampling 5% Risk of Overreliance 1001251502003.02.42.01.54.73.83.22.46.25.04.23.27.66.15.13.99.07.26.04.610.38.36.95.211.59.37.85.912.810.38.66.514.011.39.57.215.212.310.37.816.413.211.18.4 Evaluating Sample Results Using Attributes Sampling 10% Risk of Overreliance 1001251502002.31.91.61.23.93.12.62.05.34.33.62.76.65.34.43.47.96.35.34.09.17.36.14.610.38.37.05.311.59.37.85.912.710.28.66.513.911.29.47.115.012.010.17.6
Step by Step Solution
There are 3 Steps involved in it

Get step-by-step solutions from verified subject matter experts