

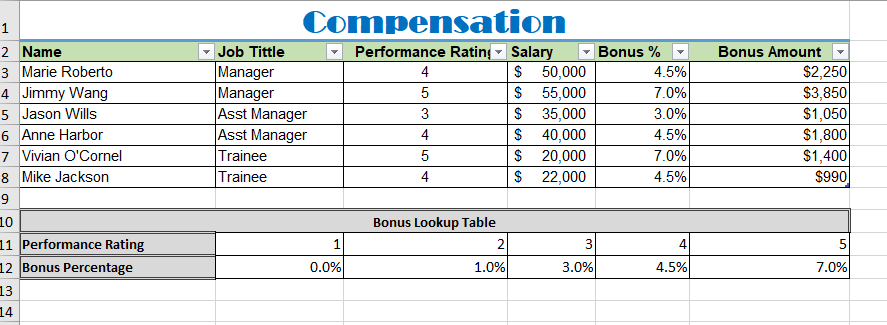
Question: a. Use the cell range A2:F8 to create a pivot table in cell H2. This pivot table will have three columns: job title, Average of
a. Use the cell range A2:F8 to create a pivot table in cell H2. This pivot table will have three columns: job title, Average of Bonus % and the count of Employees for each Job Title. (Hint: Do not drop all the fields in Columns area) Edit the header of each column to show Job Title, Average Bonus %, Number of Employees. Format the Average of Bonus % as percentage with two decimal points.
b. Create a 3-D Pie pivot chart and place it in H8:M22 that illustrates the distribution of Average Bonus %, Number of Employees by Job Title. Ensure that each slice of the pie has a data label which shows both the category name and the percentage.
Step by Step Solution
There are 3 Steps involved in it
1 Expert Approved Answer
Step: 1 Unlock

Question Has Been Solved by an Expert!
Get step-by-step solutions from verified subject matter experts
Step: 2 Unlock
Step: 3 Unlock