

Question: a. Use the data given to calculate annual returns for Goodman, Landry, and the Market Index, and then calculate average returns over the five-year period.
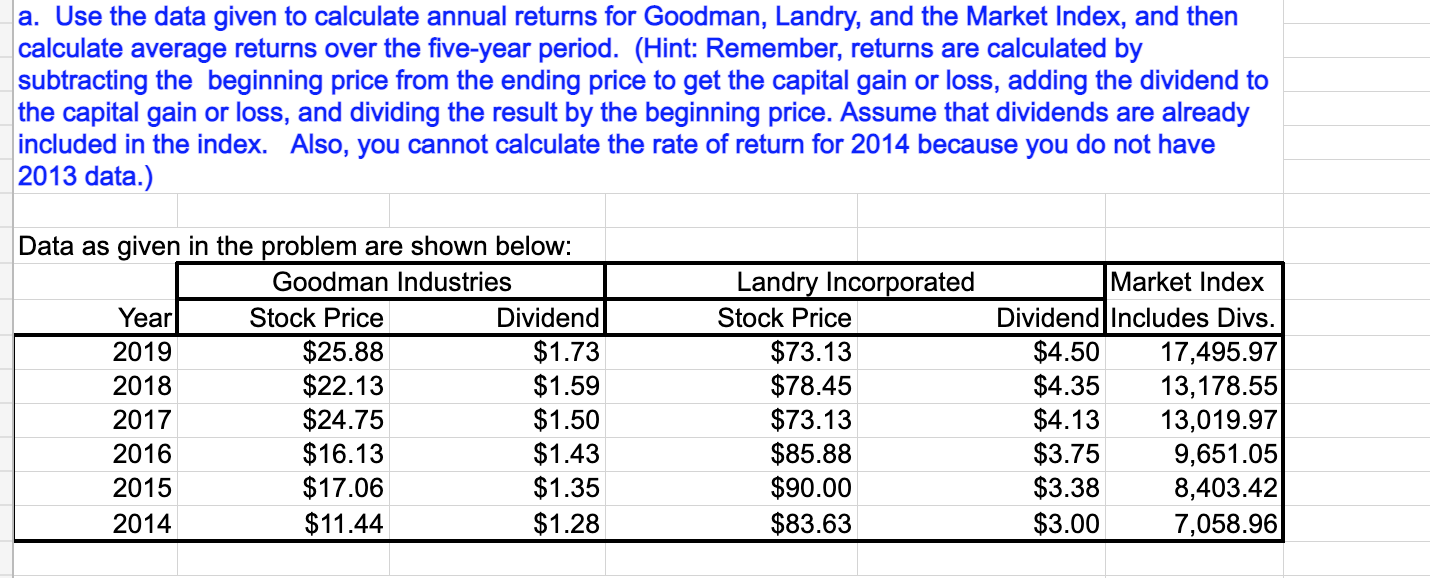
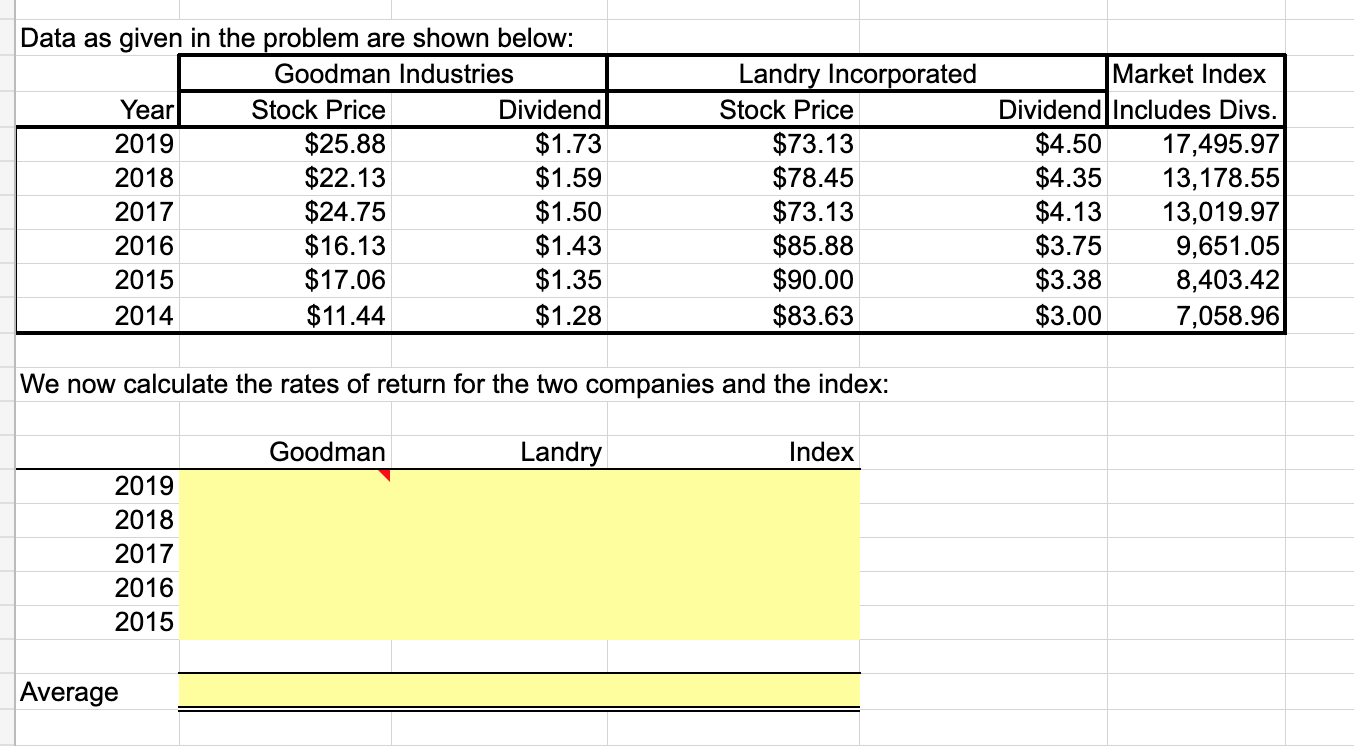

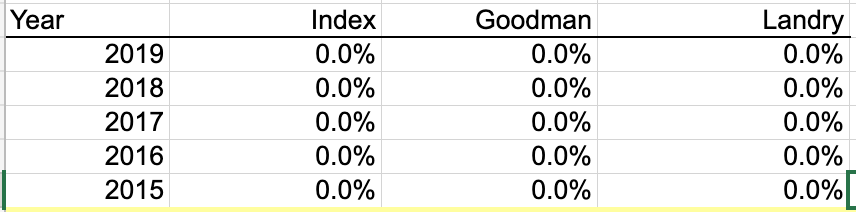
a. Use the data given to calculate annual returns for Goodman, Landry, and the Market Index, and then calculate average returns over the five-year period. (Hint: Remember, returns are calculated by subtracting the beginning price from the ending price to get the capital gain or loss, adding the dividend to the capital gain or loss, and dividing the result by the beginning price. Assume that dividends are already included in the index. Also, you cannot calculate the rate of return for 2014 because you do not have 2013 data.) Data as given in the problem are shown below: Goodman Industries Year Stock Price Dividend 2019 $25.88 $1.73 2018 $22.13 $1.59 2017 $24.75 $1.50 2016 $16.13 $1.43 2015 $17.06 $1.35 2014 $11.44 $1.28 Landry Incorporated Stock Price $73.13 $78.45 $73.13 $85.88 $90.00 $83.63 Market Index Dividend Includes Divs. $4.50 17,495.97 $4.35 13,178.55 $4.13 13,019.97 $3.75 9,651.05 $3.38 8,403.42 $3.00 7,058.96 Data as given in the problem are shown below: Goodman Industries Yearl Stock Price Dividend 2019 $25.88 $1.73 2018 $22.13 $1.59 2017 $24.75 $1.50 2016 $16.13 $1.43 2015 $17.06 $1.35 2014 $11.44 $1.28 Landry Incorporated Stock Price $73.13 $78.45 $73.13 $85.88 $90.00 $83.63 Market Index Dividend Includes Divs. $4.50 17,495.97 $4.35 13,178.55 $4.13 13,019.97 $3.75 9,651.05 $3.38 8,403.42 $3.00 7,058.96 We now calculate the rates of return for the two companies and the index: Goodman Landry Index 2019 2018 2017 2016 2015 Average Note: To get the average, you could get the column sum and divide by 5, but you could also use the function wizard, fx. Click fx, then statistical, then Average, and then use the mouse to select the proper range. Do this for Goodman and then copy the cell for the other items. the sample standard deviation formula given in the chapter, which corresponds to the STDEV function in Excel.) Use the function wizard to calculate the standard deviations. Goodman Landry Index Standard deviation of returns c. Construct a scatter diagram graph that shows Goodman's and Landry' returns on the vertical axis and the Market Index's returns on the horizontal axis. It is easiest to make scatter diagrams with a data set that has the X-axis variable in the left column, so we reformat the returns data calculated above and show it just below. Year 2019 2018 2017 2016 2015 Index 0.0% 0.0% 0.0% 0.0% 0.0% Goodman 0.0% 0.0% 0.0% 0.0% 0.0% Landry 0.0% 0.0% 0.0% 0.0% 0.0%
Step by Step Solution
There are 3 Steps involved in it

Get step-by-step solutions from verified subject matter experts