

Question: a. Use the data given to calculate annual returns for Goodman, Landry, and the Market Index, and then calculate average returns over the five-year period.
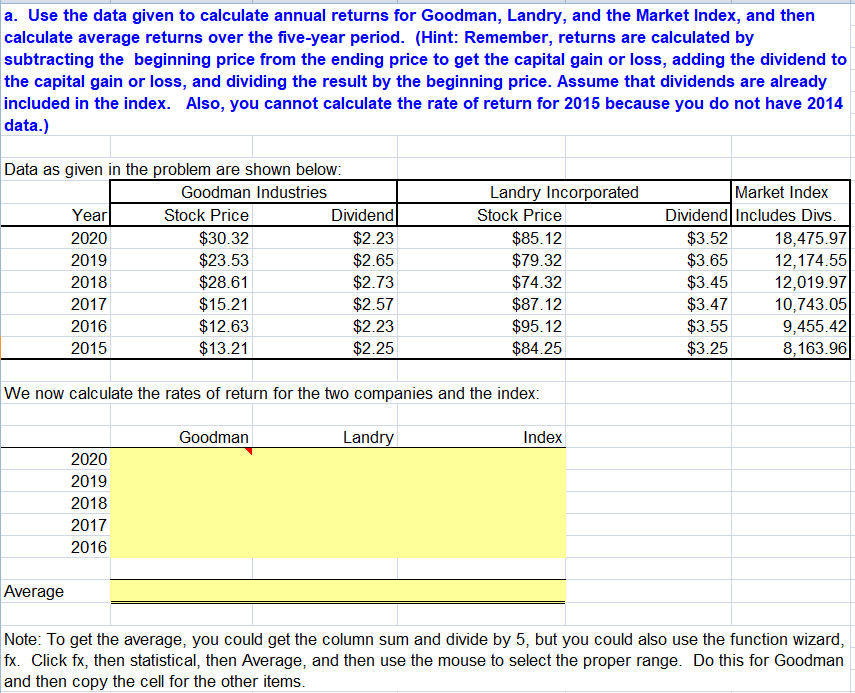
a. Use the data given to calculate annual returns for Goodman, Landry, and the Market Index, and then calculate average returns over the five-year period. (Hint: Remember, returns are calculated by subtracting the beginning price from the ending price to get the capital gain or loss, adding the dividend to the capital gain or loss, and dividing the result by the beginning price. Assume that dividends are already included in the index. Also, you cannot calculate the rate of return for 2015 because you do not have 2014 data.) Data as given in the problem are shown below: Goodman Industries Year Stock Price Dividend 2020 $30.32 $2.23 2019 $23.53 $2.65 2018 $28.61 $2.73 2017 $15.21 $2.57 2016 $12.63 $2.23 2015 $13.21 $2.25 Landry Incorporated Stock Price $85.12 $79.32 $74.32 $87.12 $95.12 $84.25 Market Index Dividend Includes Divs. $3.52 18,475.97 $3.65 12,174.55 $3.45 12,019.97 $3.47 10,743.05 $3.55 9,455.42 $3.25 8,163.96 We now calculate the rates of return for the two companies and the index: Goodman Landry Index 2020 2019 2018 2017 2016 Average Note: To get the average, you could get the column sum and divide by 5, but you could also use the function wizard, fx. Click fx, then statistical, then Average, and then use the mouse to select the proper range. Do this for Goodman and then copy the cell for the other items
Step by Step Solution
There are 3 Steps involved in it

Get step-by-step solutions from verified subject matter experts