

Question: A) Use the density histograms to compute the probability that a randomly chosen household earns a weekly income greater than 700 in the South West.
A) Use the density histograms to compute the probability that a randomly chosen household earns a weekly income greater than 700 in the South West.
B) What is the same probability in the North West? c. Use the density histogram to compute the probability that a randomly chosen household earns between 200 and 300 in the South West. What is the same probability in the North West?
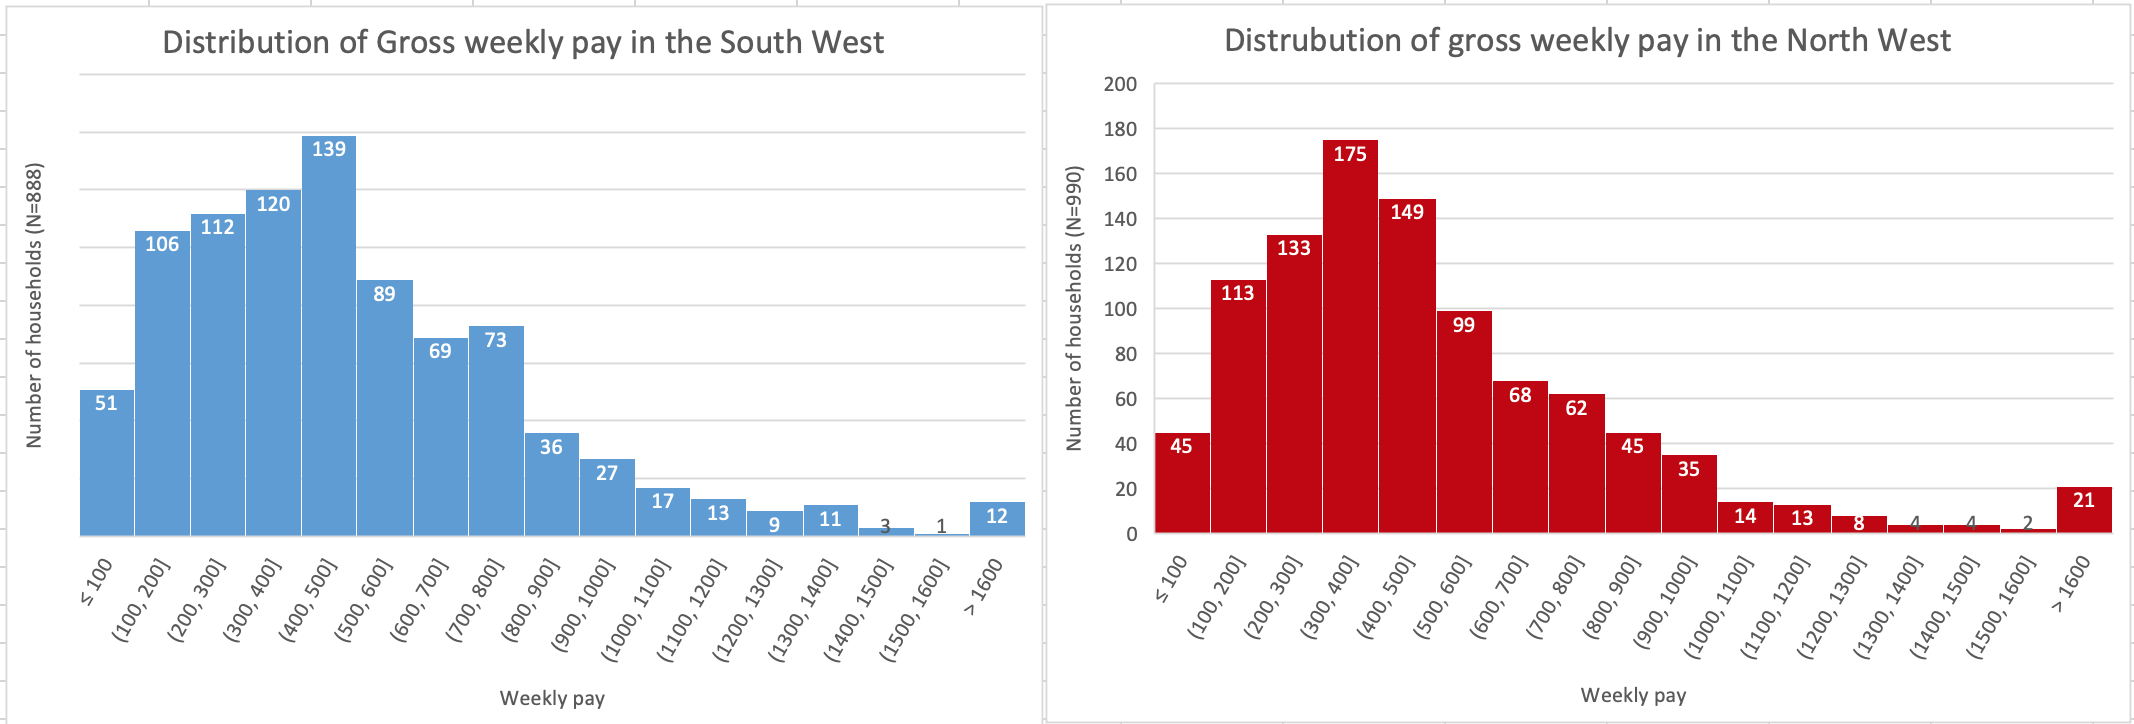
Distrubution of gross weekly pay in the North West Distribution of Gross weekly pay in the South West 200 180 175 139 160 149 120 140 112 133 106 120 113 89 Number of households (N=990) 100 99 Number of households (N=888) 73 69 80 68 60 62 51 40 45 36 35 27 20 21 17 14 13 8 13 11 12 9 O > 1600 S 100 > 1600 (100, 200] (300, 400] (400, 500] (500, 600] (600, 700] (700, 800] (800, 900] (200, 300] (900, 1000] (1000, 1100] (1100, 1200] (1200, 1300] (1300, 1400] (1400, 1500] (1500, 1600] S 100 (600, 700] (700, 800] (800, 900] (1300, 1400] (1400, 1500] (1500, 1600] (100, 200] (200, 300] (300, 400] (400, 500] (500, 600] (900, 1000] (1000, 1100] (1100, 1200] (1200, 1300] Weekly pay Weekly pay
Step by Step Solution
There are 3 Steps involved in it

Get step-by-step solutions from verified subject matter experts