

Question: a. Use the given code to convert 'bit_stream' that is generated in Part I c. to a, and by, and plot the constellation. b.
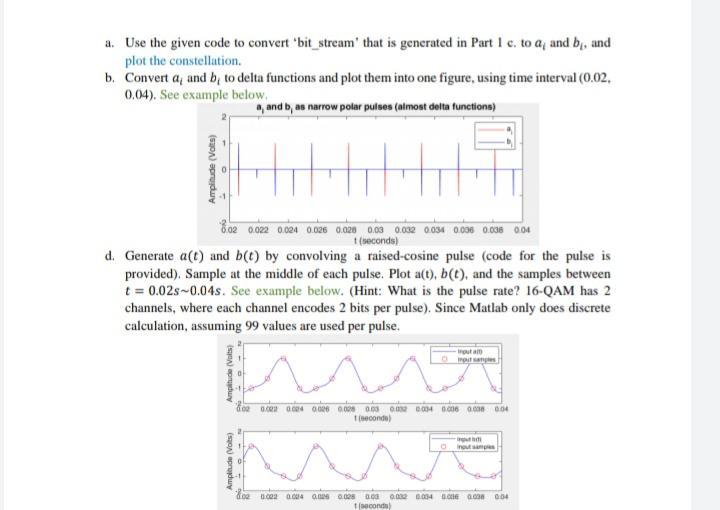
a. Use the given code to convert 'bit_stream' that is generated in Part I c. to a, and by, and plot the constellation. b. Convert a, and b, to delta functions and plot them into one figure, using time interval (0.02. 0.04). See example below. a, and b, as narrow polar pulses (almost delta functions) Amplitude (Volts) 8.02 0.022 0.024 0.025 0.028 0.03 0.032 0.034 0.036 0.036 0.04 t(seconds) d. Generate a(t) and b(t) by convolving a raised-cosine pulse (code for the pulse is provided). Sample at the middle of each pulse. Plot a(t), b(t), and the samples between t = 0.02s~0.04s. See example below. (Hint: What is the pulse rate? 16-QAM has 2 channels, where each channel encodes 2 bits per pulse). Since Matlab only does discrete calculation, assuming 99 values are used per pulse. Amplitude (Volts) Amplitude (Volts) Input att Oput samples AX 602 0.002 0.024 0.026 0.028 0.03 0032 0.034 0006 0.008 0.04 1(seconde) 0 Input samples 02 0.002 0.024 0.025 0.025 0.00 0.002 0.034 0.00 0.008 0:04 (seconds)
Step by Step Solution
3.33 Rating (153 Votes )
There are 3 Steps involved in it
a To convert the bitstream into a and b and plot the constellation you can use the provided code Bel... View full answer

Get step-by-step solutions from verified subject matter experts