

Question: Use MATLAB to plot curves like those shown in Figure 10.25. Use fzero in MATLAB to find the processing gain required to give a desired
Figure 10.25
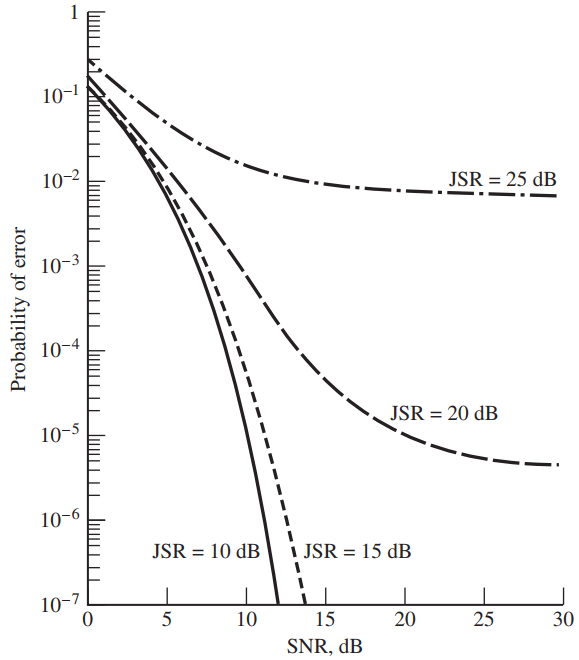
10-1 10-2 JSR = 25 dB 10-3 10-4 JSR = 20 dB %3D 10-5 10-6 JSR = 10 dB JSR = 15 dB 10-7 15 5 10 20 25 30 SNR, dB Probability of error i
Step by Step Solution
★★★★★
3.41 Rating (157 Votes )
There are 3 Steps involved in it
1 Expert Approved Answer
Step: 1 Unlock

clf A charxo GpdB inputEnter desired processing gain in dB Gp 10GpdB10 zdB 0530 z 10zdB10 k 1 JSR0 f... View full answer
Question Has Been Solved by an Expert!
Get step-by-step solutions from verified subject matter experts
Step: 2 Unlock
Step: 3 Unlock