

Question: (a) Use the MATLAB plot function surf(x,y,z) to create a 3D plot of the surface z(x,y) defined in the following. Properly label the x,y and
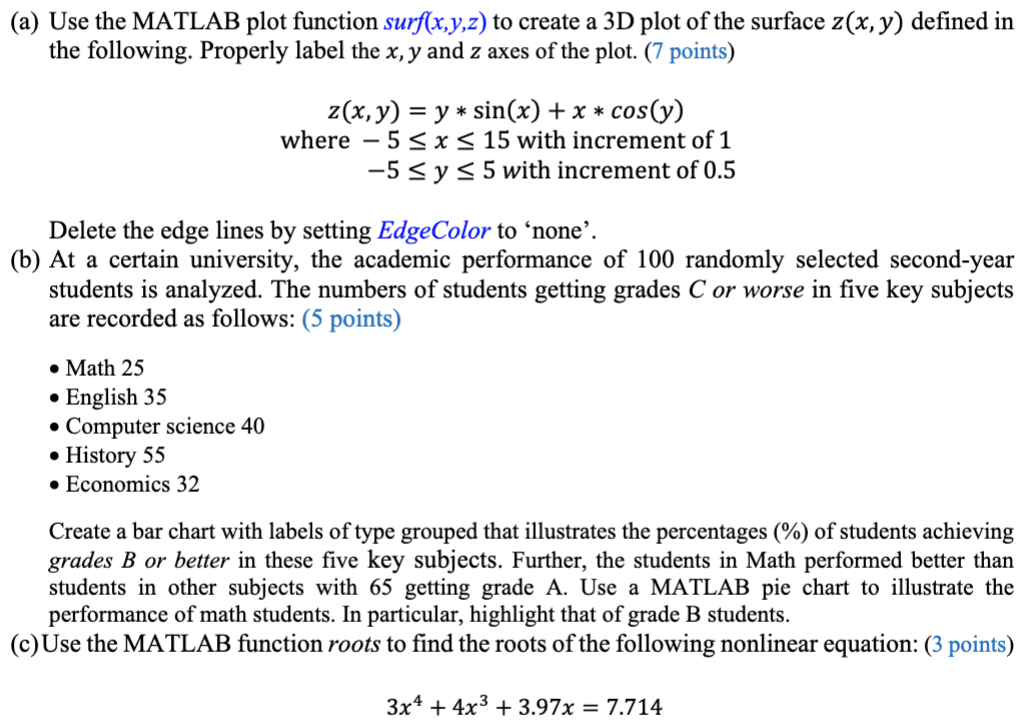
(a) Use the MATLAB plot function surf(x,y,z) to create a 3D plot of the surface z(x,y) defined in the following. Properly label the x,y and z axes of the plot. (7 points) z(x,y)where55=ysin(x)+xcos(y)x15withincrementof1y5withincrementof0.5 Delete the edge lines by setting EdgeColor to 'none'. (b) At a certain university, the academic performance of 100 randomly selected second-year students is analyzed. The numbers of students getting grades C or worse in five key subjects are recorded as follows: (5 points) - Math 25 - English 35 - Computer science 40 - History 55 - Economics 32 Create a bar chart with labels of type grouped that illustrates the percentages (\%) of students achieving grades B or better in these five key subjects. Further, the students in Math performed better than students in other subjects with 65 getting grade A. Use a MATLAB pie chart to illustrate the performance of math students. In particular, highlight that of grade B students. (c) Use the MATLAB function roots to find the roots of the following nonlinear equation: (3 points) 3x4+4x3+3.97x=7.714
Step by Step Solution
There are 3 Steps involved in it

Get step-by-step solutions from verified subject matter experts