

Question: a) Using EXCEL draw a normal and log-normal probability for the observed peaks. Comment distribution fits the data better. b) Fit the log-normal distribution to
a) Using EXCEL draw a normal and log-normal probability for the observed peaks. Comment
distribution fits the data better.
b) Fit the log-normal distribution to the data and compute the 5, 30, 50, and 100 year flood peaks and their 90% confidence limits. Plot the fitted quantiles and their confidence limits. On a log normal probability plot the fitted distributions and their 90% confidence limits and the observed data.
c) Fit the log Pearson III distribution to the data and compute the 5, 30, 50, and 100 year flood peaks and their 90% confidence limits. On a log normal probability plot the fitted distributions and their 90% confidence limits and the observed data. Comment
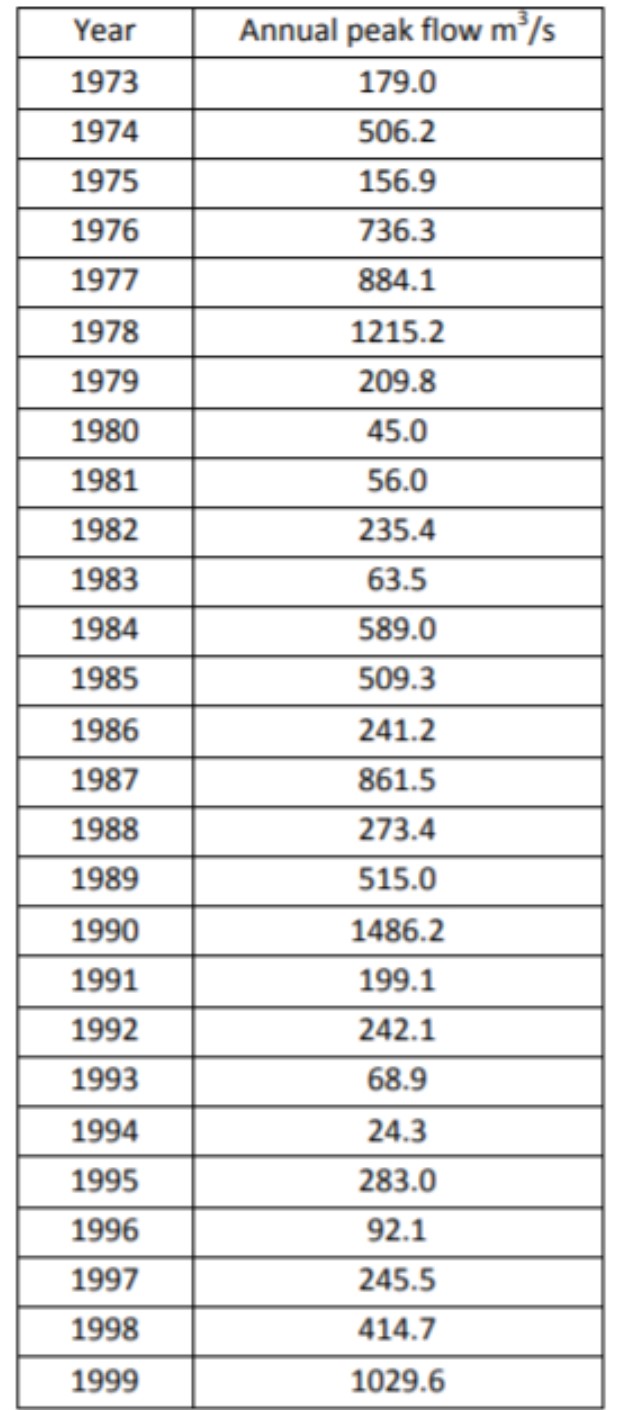
Year Annual peak flow m'/s 1973 179.0 1974 506.2 1975 156.9 1976 736.3 1977 884.1 1978 1215.2 1979 209.8 1980 45.0 1981 56.0 1982 235.4 1983 63.5 1984 589.0 1985 509.3 1986 241.2 1987 861.5 1988 273.4 1989 515.0 1990 1486.2 1991 199.1 1992 242.1 1993 68.9 1994 24.3 1995 283.0 1996 92.1 1997 245.5 1998 414.7 1999 1029.6
Step by Step Solution
There are 3 Steps involved in it

Get step-by-step solutions from verified subject matter experts